
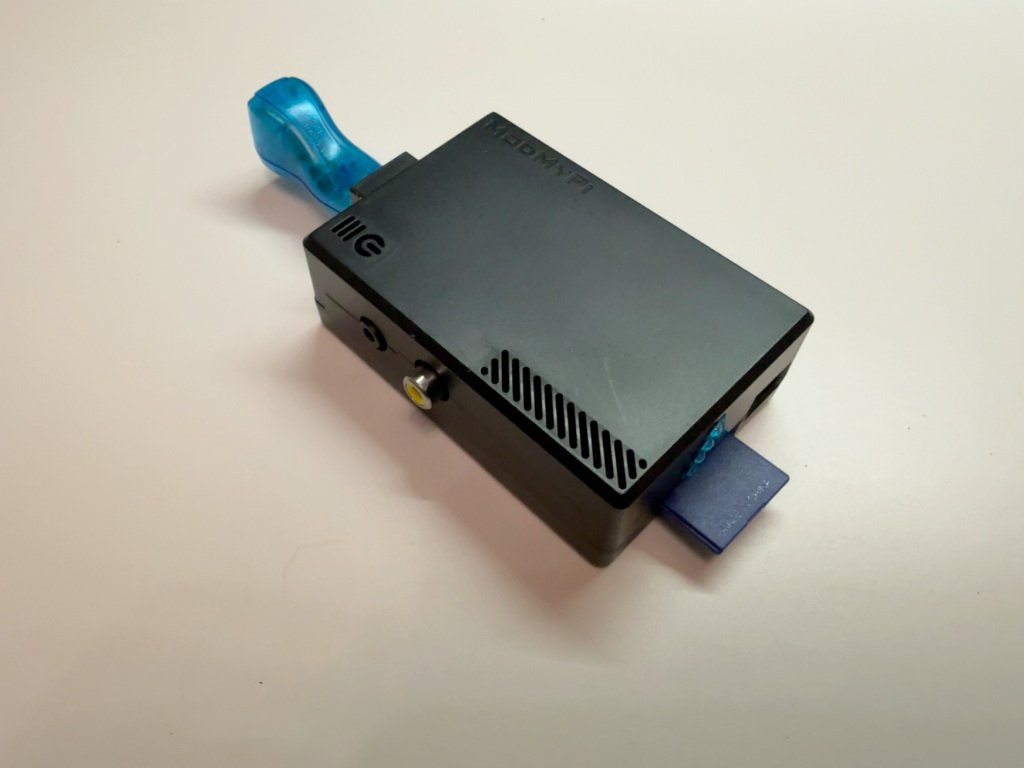
This first blog covers a 12 year project to record temperature and wind speed data in my location. I was given a Dallas 1 wire weather station in 2010 and decided to use my first pi to collect data . For uptime and resilience this little setup has lasted the elements only stopping recording in 2023 .
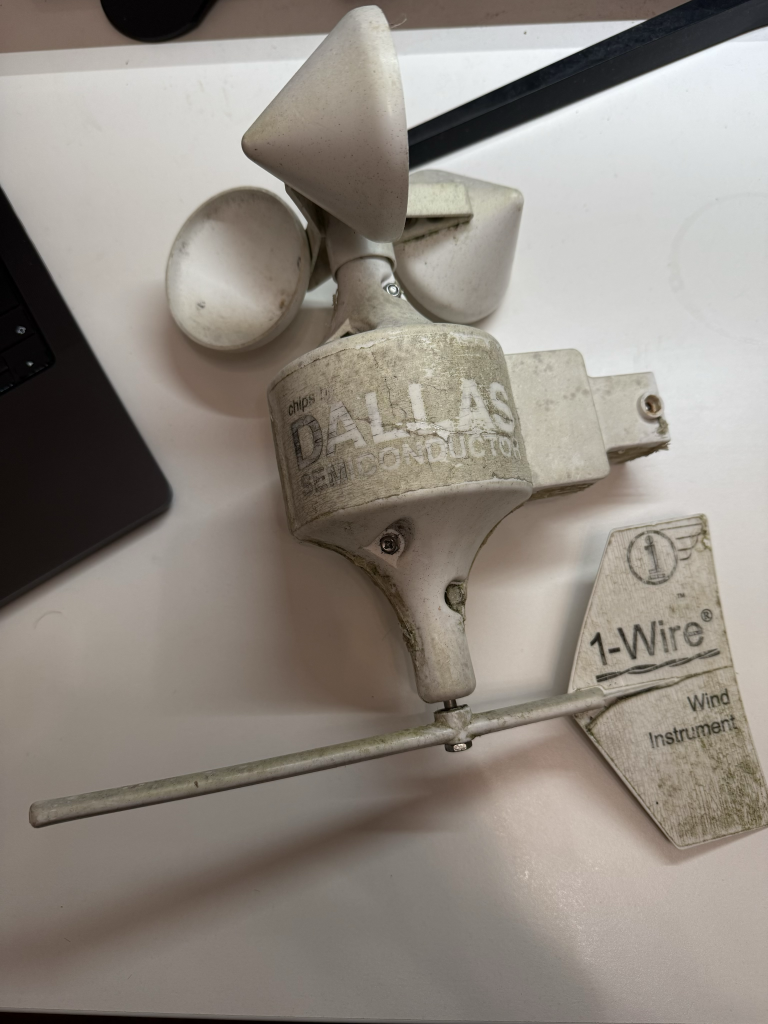
The Dallas 1-wire system is an excellent solution , with wind speed , rain and temperature. I ran the w1retap software (https://www.daria.co.uk/wx/w1retap.pdf)
which then periodically updated a sqlite database. Once again another resilient solution that kept uptime better than some of the hyperscalers. Sadly the elements have been harsh on this sensor and I’ll give it a one last try before i give up . Its done an outstanding job logging data and i plan to also publish the wind speed data i.e. extreme’s as well by year watch this space. I hope the data and analysis provides a source of information for others. A replacement is now in place but thats the subject of another blog.
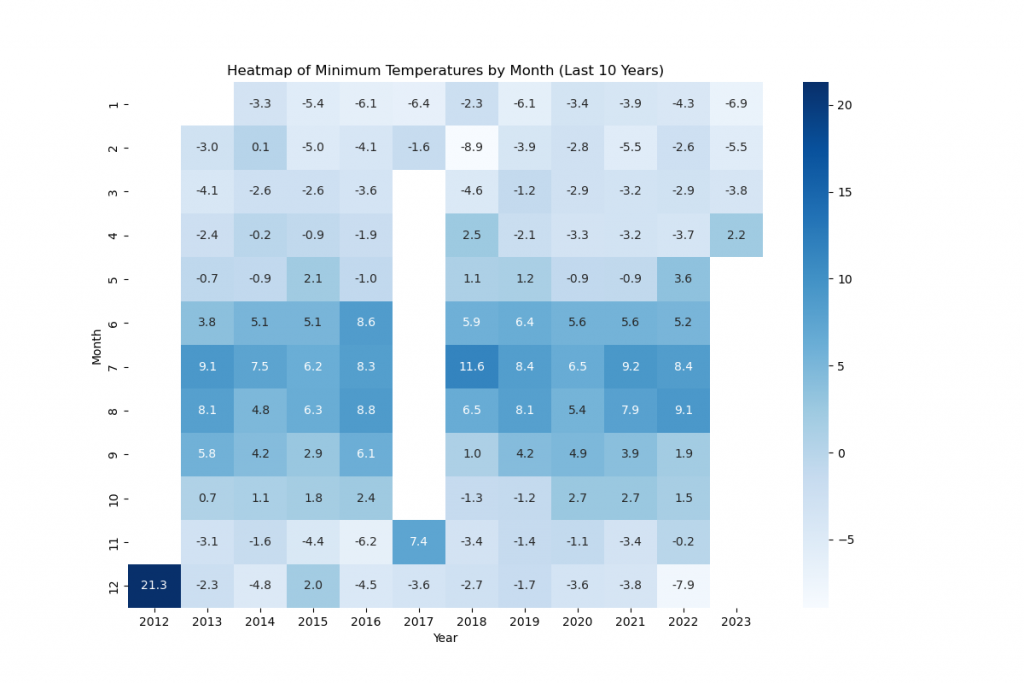
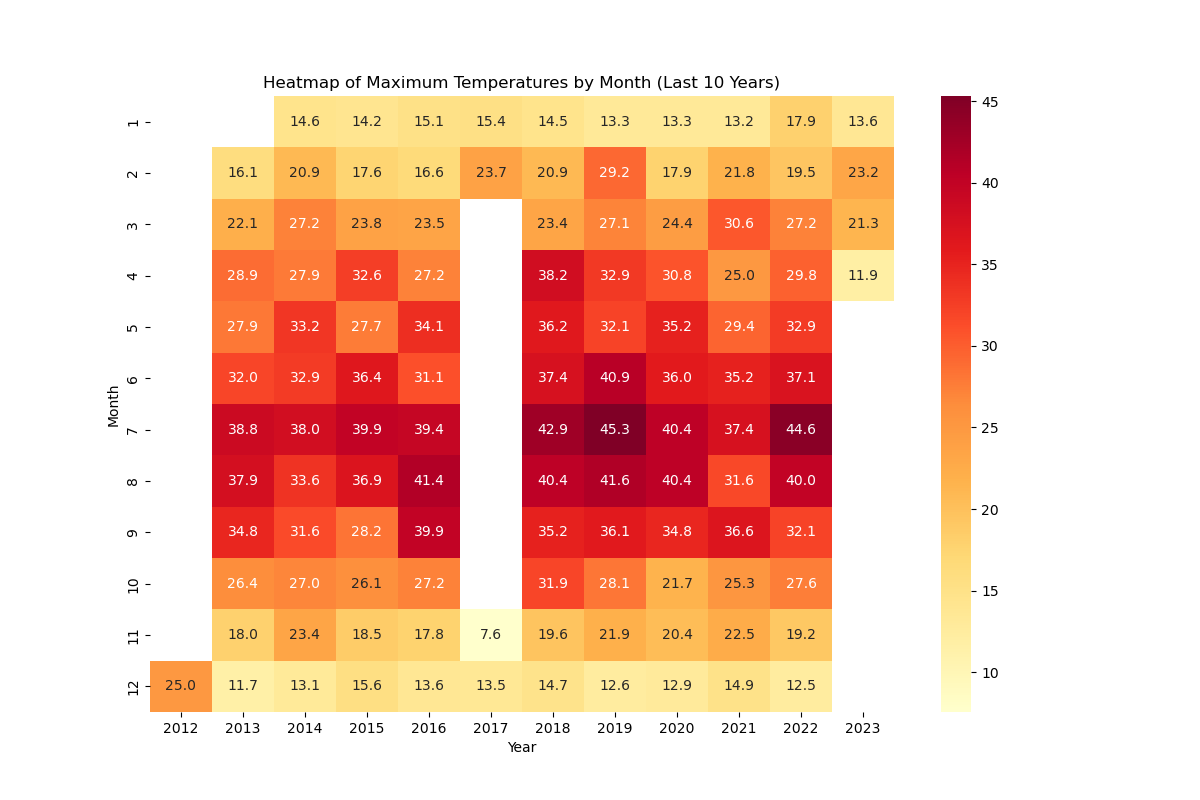
Over 12 years its has recorded over 80670 temperature data points . There have been gaps due to power cuts and one very rogue high temperature. None the less this data has allowed me to analyse temperature ranges for my local area over a twelve year period. There is a visible increase temperatures are going up . Noticeably highs and lows are increasing.
For further details and access to the data set i have chosen to host it in the open source ckan platform. All the readings are broken into years. These can be easily downloaded and used in an jupyter notebook. To generate these visualisations.
Leave a Reply