Environmental sensor data for 6 Jan 2026, 06:46–23:07 — 3,149 readings, covering approximately 36.1 km.
Location Map
Particulate Matter (PM)
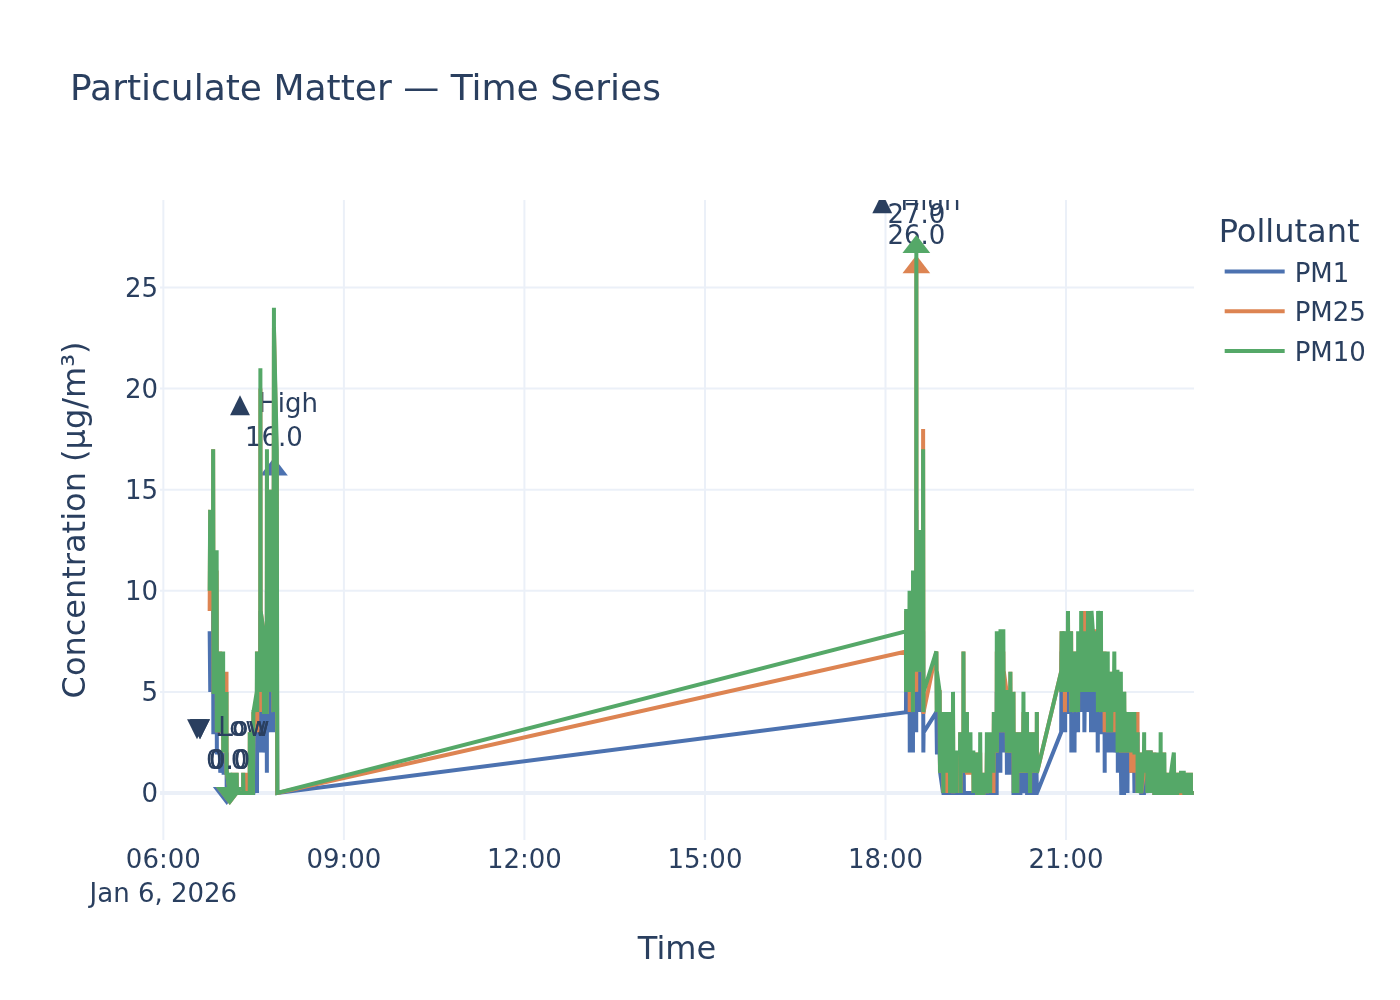
Time-series for PM1, PM2.5, and PM10.
Static image
Particulate Matter Readings Well Below UK Legal Limits, But Health Risks Remain for PM2.5
An environmental sensor recorded particulate matter levels during a recent sampling session, providing insights into PM1, PM2.5, and PM10 concentrations.
Findings
During the sampling session, the mean PM10 concentration was recorded at 3.7 µg/m³, with a high of 27.0 µg/m³. These figures are well within the UK's legal limits, which permit an annual mean of 40 µg/m³ and a 24-hour mean of 50 µg/m³, the latter not to be exceeded more than 35 times in a single year, as mandated by the Air Quality Standards Regulations 2010.
For PM2.5, the mean concentration stood at 3.4 µg/m³, significantly below the UK’s annual average limit of 20 µg/m³. This UK standard for PM2.5 requires efforts towards ‘reducing emissions/concentrations’ (City of London Air Quality Strategy 2025-2030, Table A2.3; Particulate matter (PM10_PM2.5) - GOV.UK.pdf). However, the World Health Organisation’s (WHO) 2021 guidelines advocate for a ‘considerably lower level’ for annual mean PM2.5 than the UK’s pre-existing legal limit (LAQM-Policy-Guidance-2022.pdf). The WHO explicitly states there is ’no safe limit of exposure to PM2.5,’ asserting that ‘any reduction in PM2.5 leads to positive health outcomes’ (City of London Air Quality Strategy 2025-2030, page 41).
PM1, with a mean reading of 1.9 µg/m³ and a high of 16.0 µg/m³, is also reported. However, the available policy documents do not specify UK legal limits or WHO guidelines for PM1.
Analysis
Despite the reported particulate matter concentrations falling well within current UK legal limits for PM10 and PM2.5, the public health implications, particularly concerning PM2.5, remain significant. The World Health Organisation's unequivocal stance is that there is no safe level of exposure to PM2.5, underscoring that any reduction in its concentration yields positive health outcomes.
PM2.5 poses a notable threat due to its capacity to deeply penetrate the lungs, leading to irritation, corrosion of alveolar walls, impaired lung function, and even entry into the bloodstream. Both short-term exposure to elevated concentrations, which exacerbates pre-existing respiratory and cardiovascular conditions in vulnerable populations like the elderly and children, and long-term exposure, linked to serious ailments including respiratory and cardiovascular disease, cancer, and dementia, are well-documented health consequences (LAQM-Policy-Guidance-2022.pdf).
While UK policy mandates ‘working towards reducing emissions/concentrations’ of PM2.5, the WHO’s more stringent perspective highlights the ongoing imperative for further cuts in particulate pollution to safeguard public health. The detection of PM1, though currently without specific policy guidelines, suggests the presence of ultrafine particles that warrant further investigation into their potential health impacts. Beyond human health, particulate pollution contributes to broader environmental concerns, with components like black carbon implicated in climate change and secondary PM contributing to environmental degradation (air_pollution_uk_2024_issue_1.pdf).
Data Gaps
A precise comparison against World Health Organisation guidelines for PM2.5 and PM10 is hampered by the absence of exact numerical values for their 2021 recommendations within the retrieved policy documents. Furthermore, the policy context does not provide specific UK legal limits or WHO guidelines for PM1. The averaging period for the 'mean' readings from the environmental sensor's sampling session is not explicitly stated, which limits the confidence in direct comparison to statutory annual or 24-hour limits.
Policy Provisions
| Instrument | Threshold | Status |
|---|---|---|
| Air Quality Standards Regulations 2010 | 40 µg/m³ Annual mean (PM10) | within limits |
| Air Quality Standards Regulations 2010 | 50 µg/m³ not to be exceeded more than 35 times a year (24-hour mean PM10) | within limits |
| Air Quality Standards Regulations 2010 | 20 µg/m³ Annual mean (PM2.5) - Work towards reducing emissions/concentrations | within limits |
| WHO global air quality guidelines (2021) | considerably lower level for annual mean PM2.5 concentration than the pre-existing legal limit in the UK (20 μg/m3) | cannot determine |
Ammonia (NH₃)
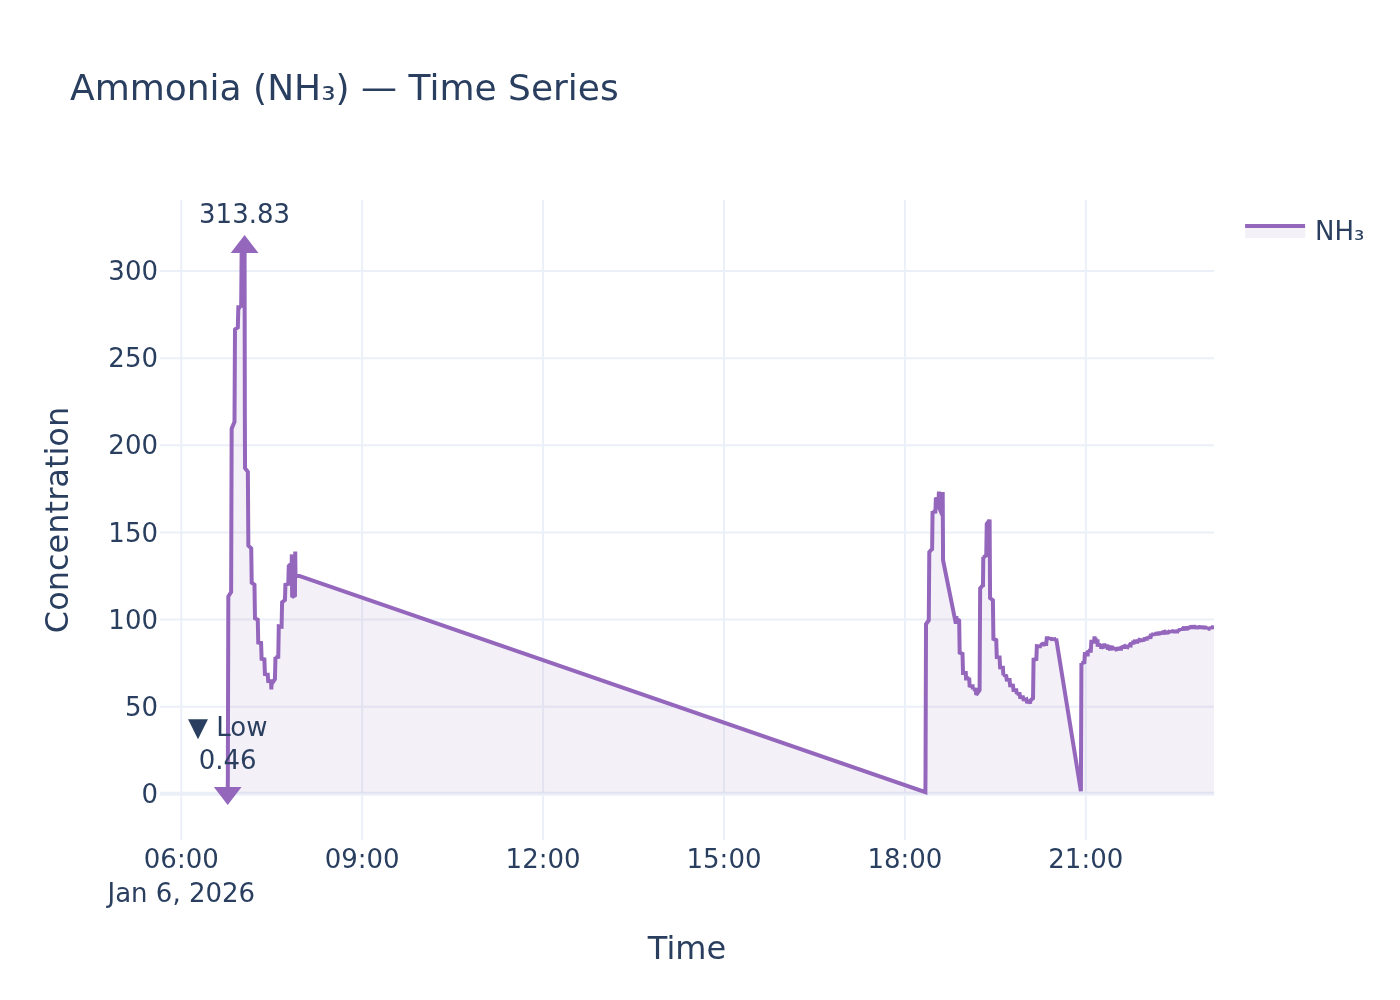
NH₃ concentration time-series.
Static image
Ammonia levels recorded at 313.83 units with no direct UK ambient air quality limits for comparison, raising concerns for sensitive ecosystems.
An environmental sensor recorded ammonia (NH₃) readings, showing a high of 313.83, a low of 0.46, and a mean concentration of 98.31. The specific location and date of these measurements were not provided.
Findings
An analysis of UK environmental policy documents reveals no explicit legal limits or World Health Organization (WHO) guidelines for ambient ammonia concentrations against which these sensor readings can be directly compared. While the National Emission Ceilings Regulations (2018) set emission reduction commitments for ammonia from anthropogenic sources, these regulations address overall emissions rather than specific ambient air quality thresholds. Therefore, it is not possible to determine if the recorded high of 313.83, low of 0.46, or mean of 98.31 constitutes a breach of an air quality standard.
Analysis
Despite the absence of specific ambient air quality limits for ammonia in the retrieved UK policy documents, the environmental implications of elevated ammonia concentrations are well-documented. Ammonia is identified as directly toxic to plants, even at very low concentrations, with certain species of moss and lichen particularly vulnerable. Increased ammonia levels can lead to significant alterations in plant community structure, allowing species that thrive in high ammonia conditions to outcompete and displace rarer species, thereby impacting associated animal species and overall biodiversity. The vast majority of ammonia emissions in the UK originate from agricultural practices, predominantly from livestock manure, urine, and the application of inorganic fertilisers. Furthermore, ammonia plays a critical role in the formation of secondary particulate matter (PM), such as ammonium sulphate and ammonium nitrate, when it reacts with other atmospheric gases like nitrogen oxides and sulphur dioxide. These secondary pollutants can persist in the atmosphere for days and travel long distances, contributing to broader air quality issues and affecting areas far from the initial emission source. While the National Emission Ceilings Regulations (2018) place a duty on the UK government to meet emission reduction commitments for ammonia, there is no corresponding legal duty regarding ambient concentration limits for public bodies to enforce based on the current policy information.
Data Gaps
The primary data gap is the absence of explicit UK legal limits or WHO guidelines for ambient ammonia (NH₃) concentrations. Without these thresholds, it is impossible to definitively assess whether the recorded sensor readings of 313.83 (high), 0.46 (low), and 98.31 (mean) represent an exceedance or fall within acceptable limits. Additional information regarding the specific averaging period for the sensor readings, the precise location, and the date of measurement would also refine any potential assessment, should future policy documents establish relevant ambient limits.
Noise
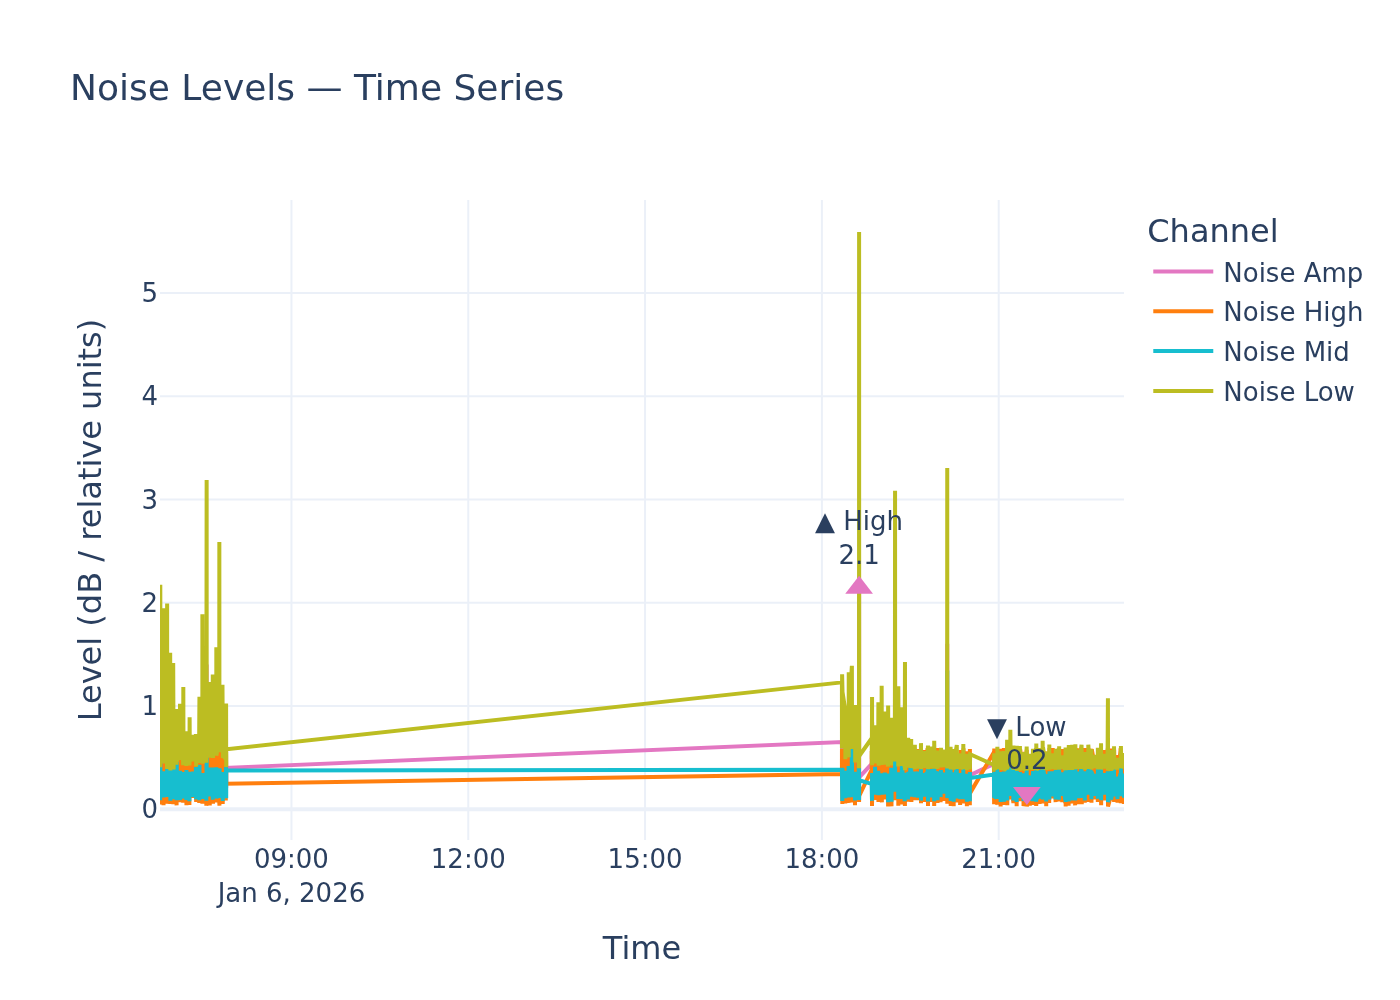
Noise level time-series.
Static image
Environmental Noise Readings in 'Relative Units' Cannot Be Compared to UK or WHO Guidelines Amidst Absence of Specific Thresholds
An environmental noise sensor recorded a high of 2.1, a low of 0.2, and a mean of 0.3 in unspecified 'relative noise units'. Without a defined standard for these units, a direct comparison to established environmental noise policy is not possible.
Findings
An environmental noise sensor registered levels with a high of 2.1, a low of 0.2, and a mean of 0.3, reported in 'relative noise units'. However, a definitive assessment against UK legal limits and World Health Organization (WHO) environmental noise guidelines cannot be made. The WHO Environmental Noise Guidelines for the European Region, and related European Union directives, typically refer to noise indicators such as Lden and Lnight. These are A-weighted average sound pressure levels, measured in decibels (dB), over specific periods (day, evening, night) and are the basis for exposure assessment and health effect studies. The UK's Noise Policy Statement for England (NPSE) outlines aims to avoid, mitigate, and minimise adverse impacts from noise, but does not specify numerical limits in the provided policy excerpts. The 'relative noise units' provided by the sensor lack a clear conversion or correlation to these standard decibel-based metrics, making it impossible to determine if the recorded levels exceed or fall within any established thresholds.
Analysis
While UK and WHO policies underscore a commitment to managing environmental noise for public health and quality of life, the implications of the reported 'relative noise units' remain unclear. The WHO guidelines, which form the basis for much of Europe's environmental noise policy, aim to safeguard citizens from environment-related risks to health by reducing noise pollution. The Noise Policy Statement for England similarly seeks to avoid significant adverse impacts on health and quality of life. However, without specific decibel-based thresholds from these policy instruments and a conversion for the 'relative noise units', it is impossible to ascertain whether the measured levels pose a risk or necessitate intervention from local authorities. The lack of specific 'Significant Observed Adverse Effect Level' (SOAEL) values in the NPSE provides policy flexibility, but also means there isn't a clear numerical trigger for action in this context.
Data Gaps
Crucially, the retrieved policy documents do not provide specific numerical limits for environmental noise (e.g., in dB for Lden or Lnight) that would allow for a direct comparison with the sensor's readings. Furthermore, the 'relative noise units' reported by the sensor are not a standard acoustic metric referenced in environmental policy, precluding any meaningful assessment. To sharpen this analysis, specific decibel-based noise thresholds from UK regulations and WHO guidelines are required, along with clarification on the measurement methodology and units used by the environmental noise sensor.
Policy Provisions
| Instrument | Threshold | Status |
|---|---|---|
| WHO Environmental Noise Guidelines for the European Region (2018) | Not specified (typically Lden, Lnight in dB) | cannot determine |
| Noise Policy Statement for England (2010) | Not specified (aims to avoid significant adverse impacts) | cannot determine |
Sample ID: samples_0475dc6a_6b15_4b51_af55_37ed40e8e023