Environmental sensor data for 12 Feb 2026, 01:46–23:50 — 133 readings.
Location Map
Particulate Matter (PM)
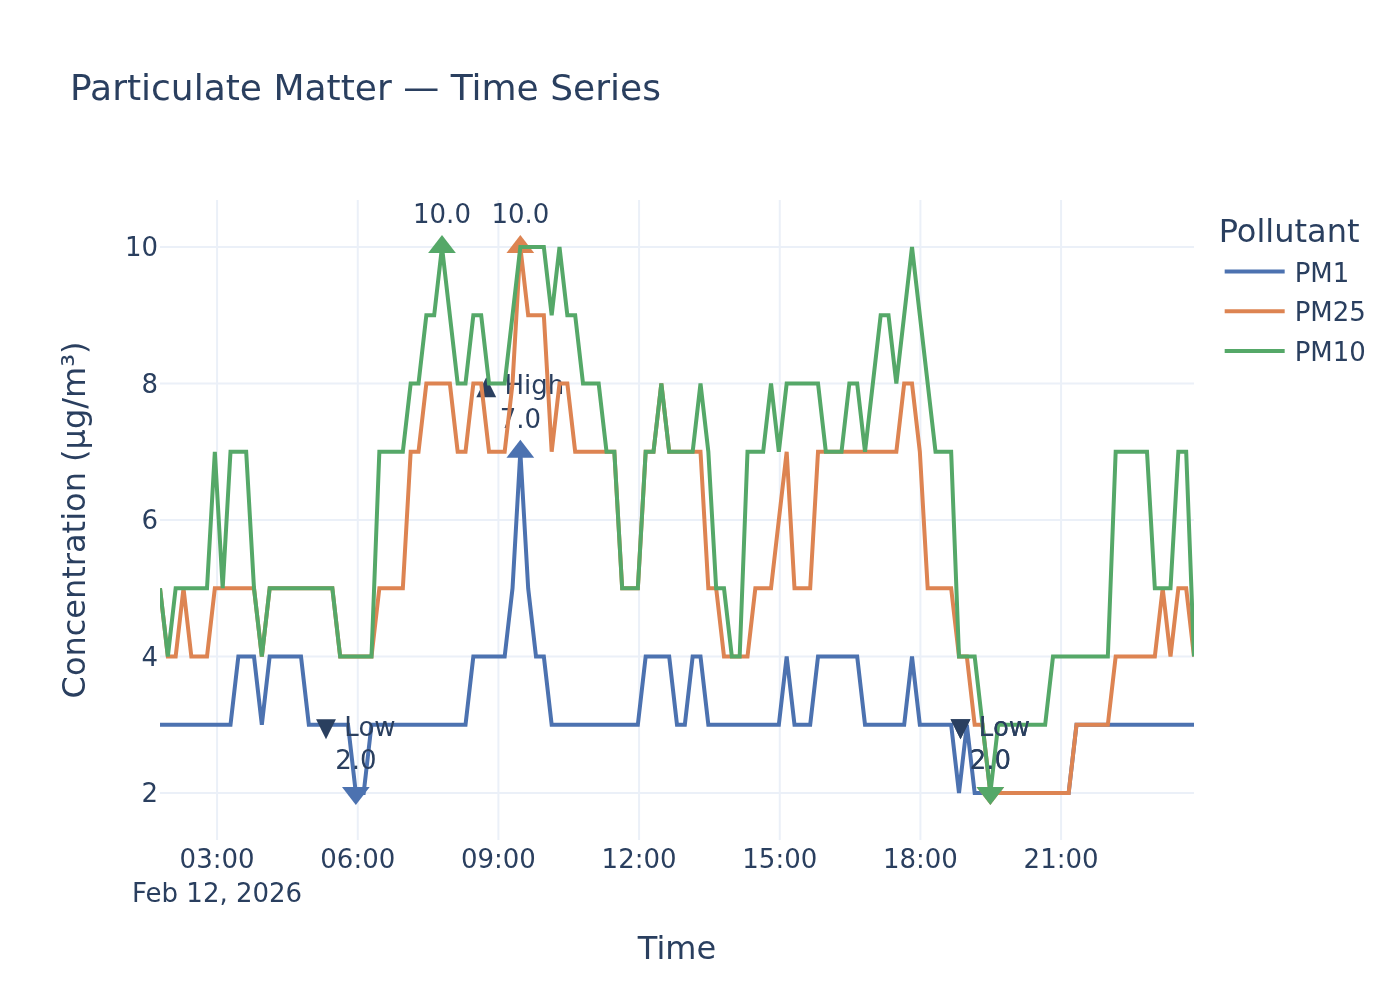
Time-series for PM1, PM2.5, and PM10.
Static image
Particulate Matter Readings Exceed WHO Annual PM2.5 Guideline, Raising Health Concerns
During an unspecified sampling session, environmental sensors recorded mean particulate matter (PM2.5) concentrations of 5.4 µg/m³ and peak concentrations of 10.0 µg/m³. PM1 and PM10 levels were also measured.
Findings
Analysis of the environmental sensor data reveals that the mean PM2.5 concentration of 5.4 µg/m³ from the sampling session surpasses the stringent World Health Organization (WHO) 2021 annual guideline of 5 µg/m³. This represents an exceedance of 8% above the recommended limit. While this reading remains well within the UK's legal annual mean limit of 20 µg/m³ for PM2.5, the WHO guideline is considerably stricter, reflecting a growing understanding of health risks associated with even low levels of particulate matter.
For PM10, the mean concentration of 6.4 µg/m³ and the high reading of 10.0 µg/m³ were comfortably within both UK legal limits and WHO guidelines. Specifically, the mean PM10 reading was 84% below the UK annual mean limit of 40 µg/m³ and 57.3% below the WHO annual guideline of 15 µg/m³. The high PM10 reading was 80% below the UK’s 24-hour mean limit of 50 µg/m³ and 77.8% below the WHO’s 24-hour guideline of 45 µg/m³.
For PM1, no specific UK legal limits or WHO guidelines were available in the consulted policy documents for comparison. The reported values were a high of 7.0 µg/m³, a low of 2.0 µg/m³, and a mean of 3.2 µg/m³.
Analysis
The exceedance of the WHO's 2021 annual guideline for PM2.5, even while remaining within the UK's less stringent legal limit, highlights a critical environmental health issue. The WHO explicitly states there is no safe limit of exposure to PM2.5, and any reduction leads to positive health outcomes. PM2.5 is particularly hazardous because it can penetrate deeply into the lungs, irritating and corroding the alveolar wall, and can even enter the bloodstream. This fine particulate matter is linked to severe short-term and long-term health impacts, including exacerbating pre-existing respiratory and cardiovascular conditions, and contributing to disease, cancer, and dementia. Vulnerable populations, such as the elderly and children, are particularly susceptible. While the UK's legal framework for PM2.5, as set out in The Air Quality Standards Regulations 2010, allows for significantly higher concentrations, the scientific consensus, reflected in the WHO guidelines, urges for more protective measures. Local authorities and policymakers bear the legal and ethical duty to work towards reducing emissions and concentrations of PM2.5 to safeguard public health, even when levels fall within current national legal limits.
Data Gaps
To provide a more precise assessment, the exact location and duration of the sampling session are crucial. This would allow for a more direct comparison with specific local air quality management areas and relevant averaging periods. Additionally, the policy documents did not contain specific UK legal limits or WHO guidelines for PM1, which would be beneficial for a comprehensive assessment of all particulate matter sizes. Information on the frequency of high readings would also be useful to assess compliance with daily exceedance limits for PM10.
Policy Provisions
| Instrument | Threshold | Status |
|---|---|---|
| Air Quality Standards Regulations 2010 (as referenced in Particulate matter (PM10_PM2.5) - GOV.UK.pdf) | 20 µg/m³ Annual mean | within limits |
| World Health Organisation (2021) WHO global air quality guidelines: Particulate matter (PM2.5 and PM10) | 5 µg/m³ Annual mean | exceeded |
| World Health Organisation (2021) WHO global air quality guidelines: Particulate matter (PM2.5 and PM10) | 15 µg/m³ 24-hour mean | within limits |
| Air Quality Standards Regulations 2010 (as referenced in Particulate matter (PM10_PM2.5) - GOV.UK.pdf) | 40 µg/m³ Annual mean | within limits |
| Air Quality Standards Regulations 2010 (as referenced in Particulate matter (PM10_PM2.5) - GOV.UK.pdf) | 50 µg/m³ 24-hour mean | within limits |
| World Health Organisation (2021) WHO global air quality guidelines: Particulate matter (PM2.5 and PM10) | 15 µg/m³ Annual mean | within limits |
| World Health Organisation (2021) WHO global air quality guidelines: Particulate matter (PM2.5 and PM10) | 45 µg/m³ 24-hour mean | within limits |
Ammonia (NH₃)
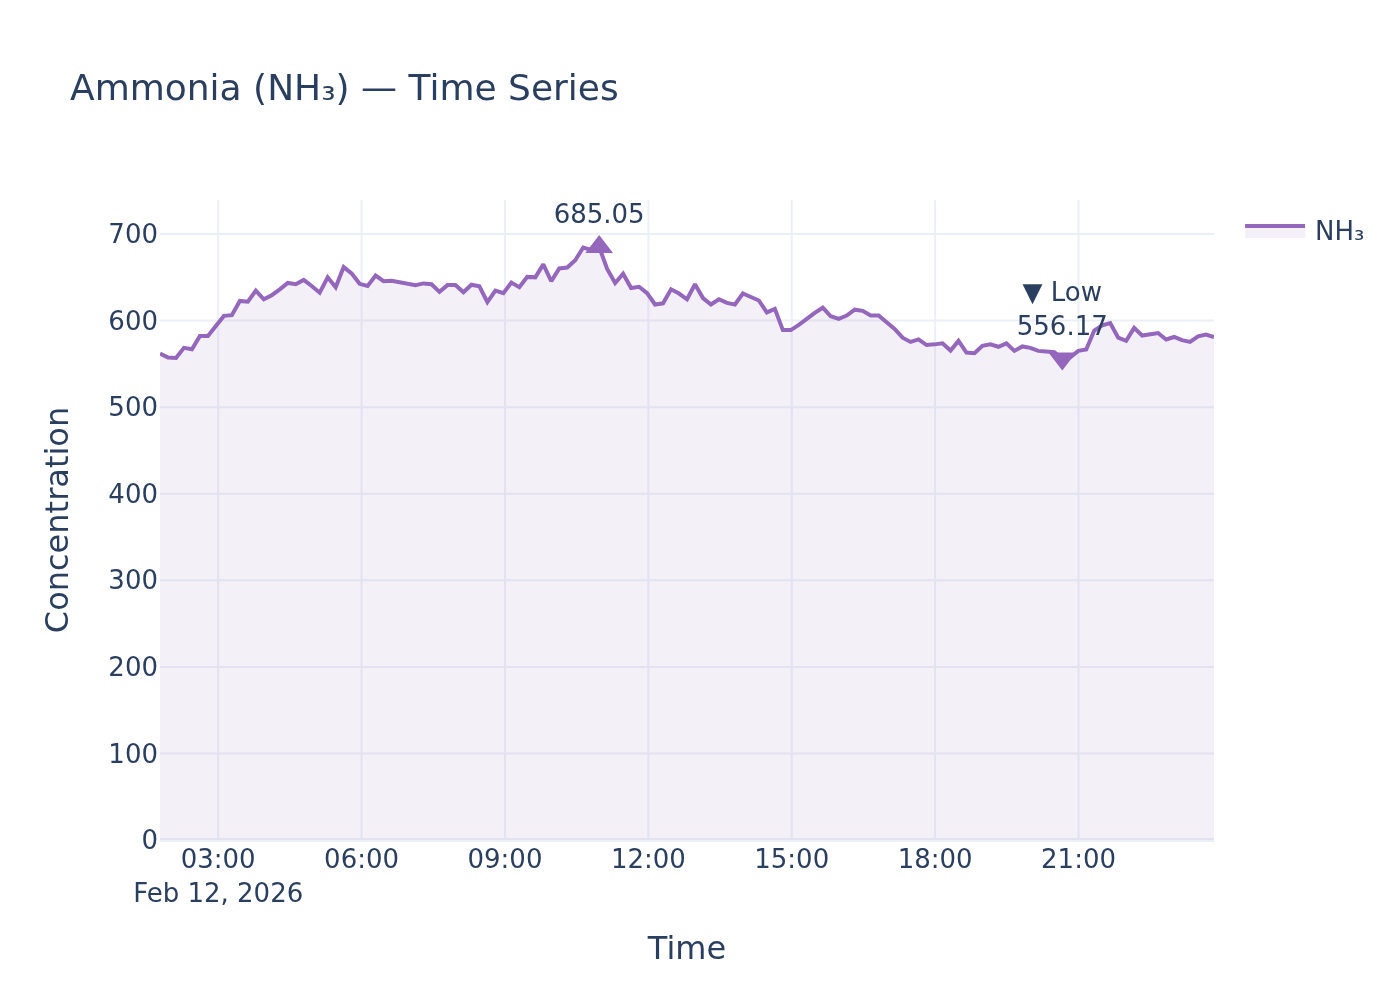
NH₃ concentration time-series.
Static image
Ammonia Readings Highlight Ecological Threat Amidst Absence of Direct UK Air Quality Limits for Human Health
An environmental sensor recorded ammonia (NH₃) levels with a high of 685.05, a low of 556.17, and a mean of 611.51. These measurements underscore the ongoing environmental presence of this gas.
Findings
An analysis of UK environmental policy documents reveals that there is no statutory Local Air Quality Management (LAQM) duty for local authorities to consider ammonia (NH₃) concentrations directly in relation to public health. While national statutory targets exist for reducing overall ammonia emissions by 8% by 2020 and 16% by 2030 from 2005 levels, and a target to reduce reactive nitrogen deposition to sensitive sites by 17% by 2030, these policy instruments do not establish specific ambient air quality limits for ammonia for direct human health protection against the reported sensor values.
Analysis
Despite the absence of direct statutory ambient air quality limits for ammonia specifically for human health, these recorded levels are pertinent due to ammonia's significant environmental and indirect health implications. Ammonia is directly toxic to plants, with some species of moss and lichen being impacted at even very low concentrations. Elevated levels can lead to common plant species dominating habitats, reducing biodiversity and altering plant community structures, which in turn affects associated animal species. Furthermore, ammonia reacts with other atmospheric gases, such as nitrogen oxides and sulphur dioxide, to form fine particulate matter (PM). This 'secondary' particulate matter can persist in the air for days and travel long distances, thereby affecting air quality in areas far removed from the original emission source and contributing to wider public health concerns associated with PM exposure. The vast majority of UK ammonia emissions, approximately 88%, originate from agricultural sources, including organic manures, livestock housing, and manufactured urea-based fertilisers. This highlights the agricultural sector's critical role in managing ammonia emissions to protect sensitive ecosystems and mitigate the formation of secondary particulate matter.
Data Gaps
The user's query did not specify the units for the recorded ammonia values (685.05, 556.17, 611.51), which would be essential for a precise comparison if statutory limits existed. More importantly, current UK environmental policy documents, as retrieved, do not establish statutory ambient air quality limits for ammonia (NH₃) that local authorities are obligated to consider for direct human health protection.
Policy Provisions
| Instrument | Threshold | Status |
|---|---|---|
| LAQM Policy Guidance 2022 | No statutory LAQM duty to consider ammonia | cannot determine |
| LAQM Policy Guidance 2022 | Reduction in emissions from 2005 levels of 8% by 2020 and 16% by 2030 | cannot determine |
| LAQM Policy Guidance 2022 | Reduce the deposition of reactive nitrogen to priority, protected sensitive sites in England by 17% by 2030 | cannot determine |
Noise
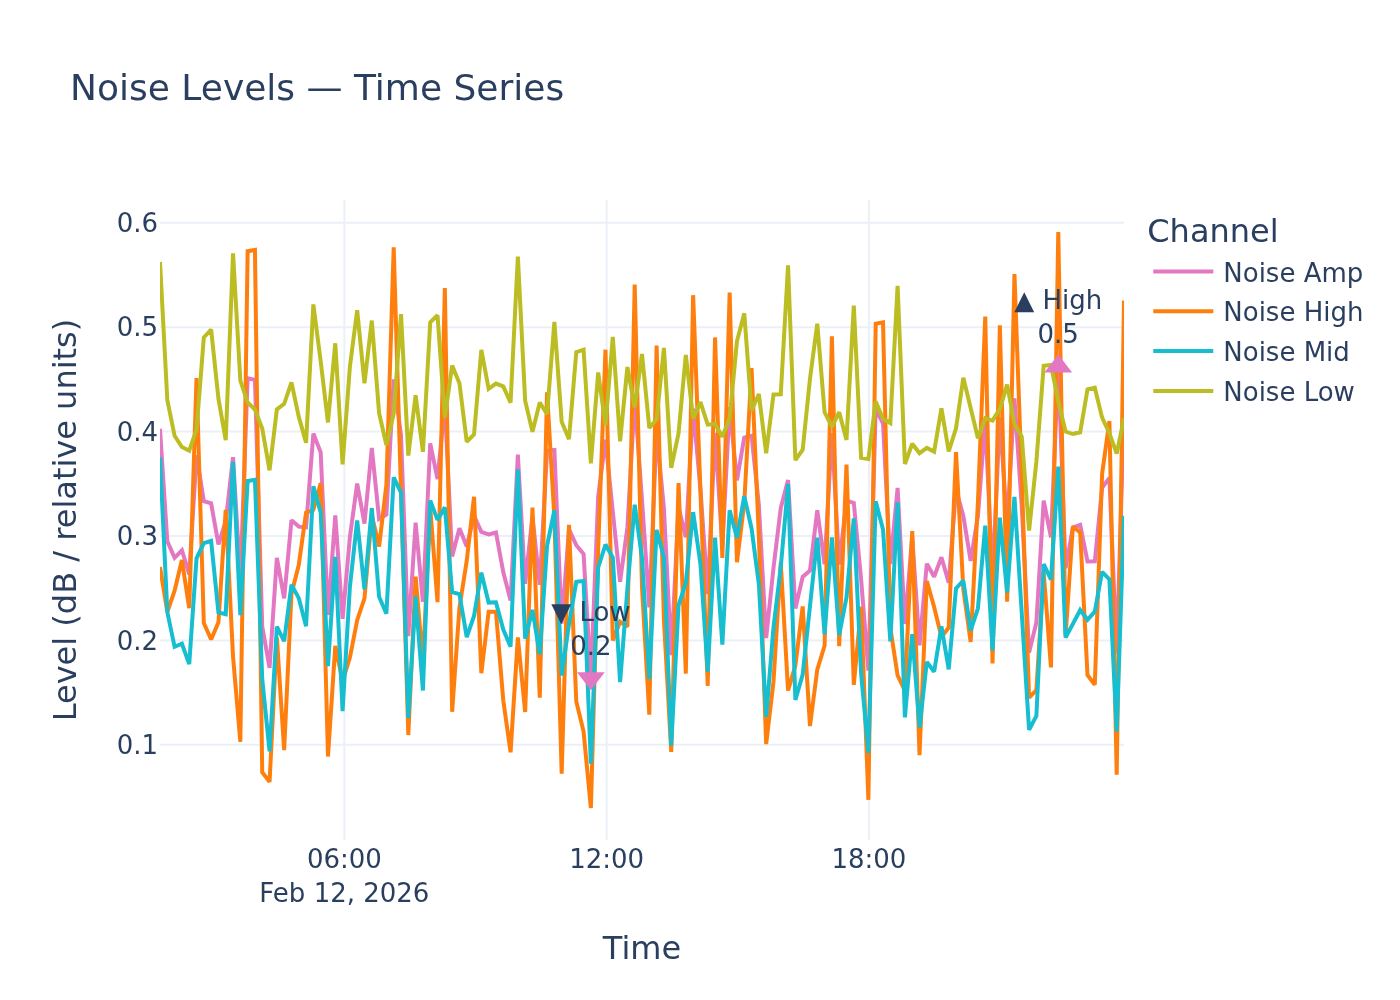
Noise level time-series.
Static image
Uncertainty shrouds local noise impact as 'relative units' hinder comparison with UK and WHO standards
At an unspecified monitoring site, an environmental noise sensor recorded a mean level of 0.3 relative noise units, with a high of 0.5 and a low of 0.2. The exact location and date of these readings were not provided.
Findings
A direct comparison of the recorded noise levels (0.2 to 0.5 relative noise units) against UK legal limits or World Health Organization (WHO) environmental noise guidelines is currently not possible. The retrieved policy documents, including the UK's Noise Policy Statement for England and WHO guidelines, primarily refer to noise measurements in decibels (dB), often using indicators such as Lden and Lnight for exposure assessment. Without a conversion or clarification of what 'relative noise units' represent in decibels, the significance of these readings in relation to established thresholds cannot be determined. Consequently, it is impossible to state whether these levels exceed or fall within any limits, or by what margin, nor can a breach of any policy provisions be confirmed.
Analysis
While specific numerical thresholds remain elusive with the provided data, both UK policy and WHO guidance underscore the serious implications of environmental noise for public health and quality of life. The UK's Noise Policy Statement for England aims to "Promote good health and a good quality of life through the effective management of noise" and seeks to "avoid significant adverse impacts on health and quality of life" and "mitigate and minimise adverse impacts." This policy, though not providing specific numerical limits for mitigation, emphasizes a framework for managing noise within the context of sustainable development. The World Health Organization recognizes environmental noise as the second largest environmental health risk in Western Europe, behind air quality, citing its association with sleep disturbance, annoyance, and serious illnesses such as heart attacks and strokes. Therefore, while the immediate impact of the reported 'relative noise units' cannot be precisely quantified against health benchmarks, the overarching policy context highlights a strong imperative for managing noise to protect public well-being.
Data Gaps
A critical data gap exists regarding the meaning of 'relative noise units' and their conversion to standard acoustic measurements like decibels (dB). Furthermore, the retrieved policy documents, while outlining the aims of noise management, do not provide specific numerical UK legal limits or WHO environmental noise guidelines in decibels (e.g., Lden, Lnight) that would allow for a direct comparison with environmental monitoring data. The lack of specific location and date also limits the ability to ground the assessment in a precise geographical or temporal context. To sharpen this assessment, specific decibel (dB) readings or a conversion key for 'relative noise units' would be required, alongside detailed numerical thresholds from UK and WHO policy documents.
Sample ID: samples_0c031ebd_db3e_44e9_8c3c_d34d0c484174