Environmental sensor data for 2 Jan 2026, 11:42–18:26 — 3,768 readings, covering approximately 8.5 km.
Location Map
Particulate Matter (PM)
Time-series for PM1, PM2.5, and PM10.
Static image
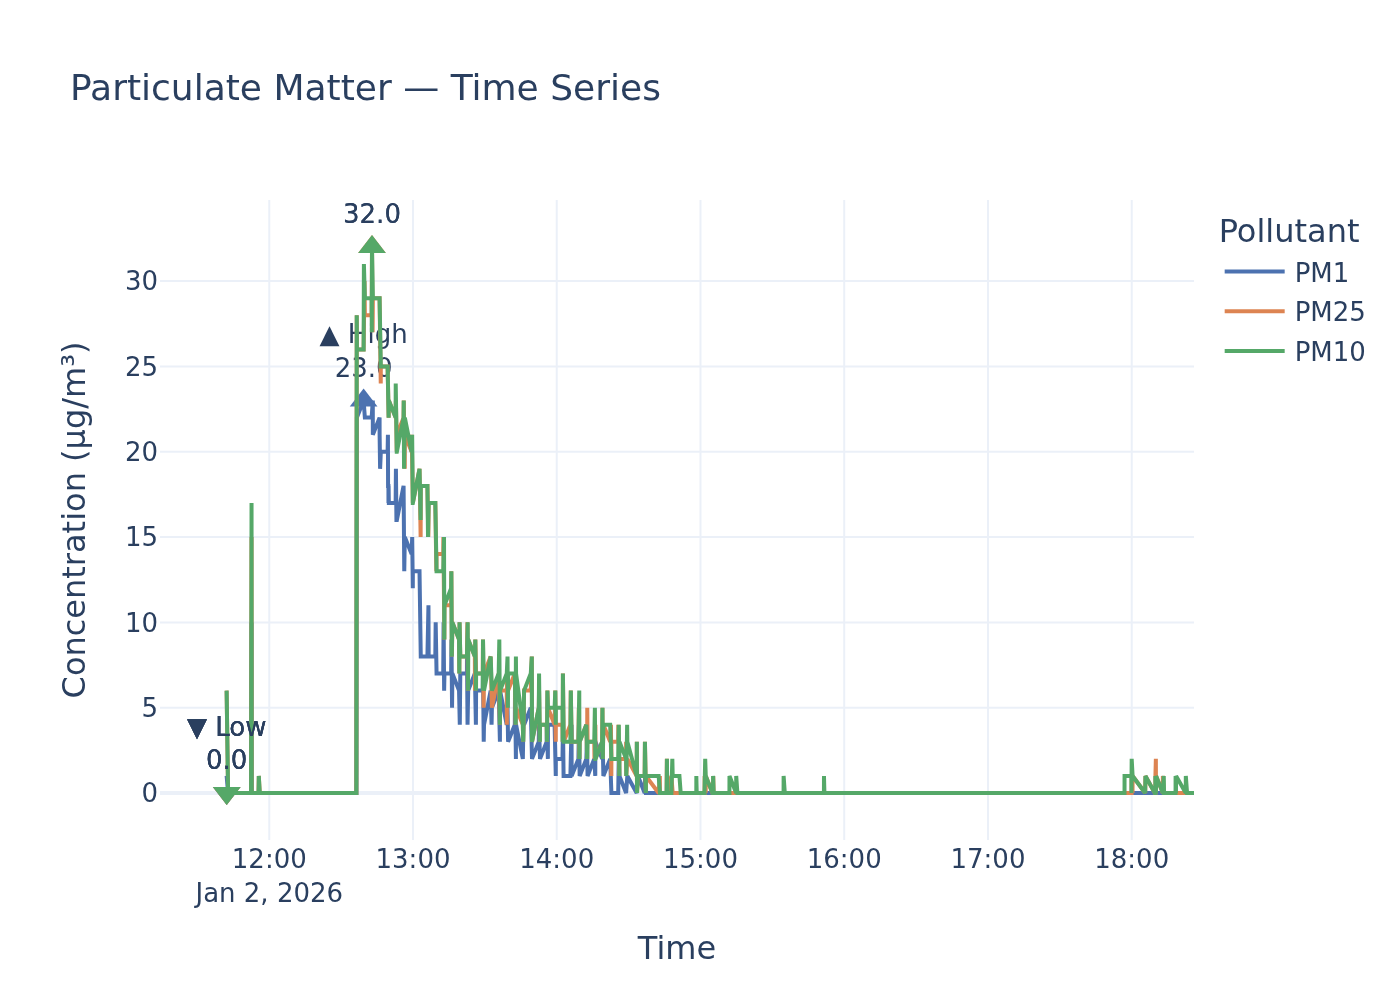
Particulate Matter Readings Remain Below UK Legal Limits, Though Health Concerns Persist
During a recent sampling session, an environmental sensor recorded particulate matter levels. The sensor reported mean concentrations of 2.1 µg/m³ for PM1, 3.1 µg/m³ for PM2.5, and 3.2 µg/m³ for PM10, with peak 'high' readings reaching 23.0 µg/m³ for PM1, 32.0 µg/m³ for PM2.5, and 32.0 µg/m³ for PM10.
Findings
Analysis of the environmental sensor data indicates that mean particulate matter concentrations for PM2.5 and PM10 are well within current UK legal limits and are also below the implied stringency of World Health Organisation (WHO) guidelines, where specific numerical values are not provided in the policy documents. The sensor's mean PM2.5 reading of 3.1 µg/m³ is significantly below the Air Quality Standards Regulations 2010 annual average limit of 20 µg/m³. Similarly, the mean PM10 concentration of 3.2 µg/m³ is substantially lower than the annual average limit of 40 µg/m³ and the 24-hour average limit of 50 µg/m³, which permits up to 35 exceedances in a single year.
While the reported ‘high’ readings for PM2.5 and PM10 both stood at 32.0 µg/m³, these single peak values, without a defined averaging period, do not constitute a breach of the UK’s legal limits, which are based on annual or 24-hour averages. The PM2.5 high reading of 32.0 µg/m³ does, however, exceed the annual average legal limit of 20 µg/m³, though it is not directly comparable as a single event. The PM10 high reading of 32.0 µg/m³ remains below the 24-hour average limit of 50 µg/m³.
For PM1, no specific UK legal limits or WHO guidelines were identified in the reviewed policy documents, preventing a direct comparison of the recorded concentrations.
Analysis
While the reported particulate matter levels generally fall within current UK legal parameters, the environmental significance and potential health implications of even low-level exposure, particularly to PM2.5, remain a critical concern. Research has consistently strengthened the evidence linking both short-term and long-term exposure to PM2.5 with a range of adverse health outcomes, including respiratory and cardiovascular effects, cancer, and dementia. Vulnerable groups, such as the elderly and children, are particularly susceptible to the exacerbation of pre-existing respiratory and cardiovascular conditions from elevated concentrations.
The World Health Organisation (WHO) underscores the severity of PM2.5 by stating there is no safe limit of exposure, indicating that any reduction in concentration yields positive health outcomes. This stance highlights a stricter approach than current UK legal limits, which, while complied with for over a decade, are still recognized by authorities as having room for further reductions to achieve public health benefits. Particulate pollution also carries environmental consequences, with black carbon contributing to climate change and secondary PM components like sulphate and nitrate impacting air quality.
Local authorities and national bodies, such as those governed by the Air Quality Standards Regulations 2010, bear the responsibility for monitoring and working towards reducing ambient particulate matter concentrations. The continuous assessment of PM levels, especially near anthropogenic sources like domestic wood burning and vehicle emissions, is crucial for effective policy intervention and public health protection.
Data Gaps
A more precise assessment would benefit from a specified location and date of the sampling session, which could enable the identification of any localised or time-bound policy considerations, such as those within specific Air Quality Management Areas. Crucially, the policy documents retrieved do not provide specific numerical WHO guideline values for PM2.5 or PM10, limiting a direct quantitative comparison against these more stringent recommendations. Additionally, the exact averaging period for the 'high' and 'mean' sensor readings was not provided, which affects the direct comparability of these figures with specific 24-hour or annual legal limits. There is also a lack of specific UK or WHO policy limits for PM1 within the retrieved documents.
Policy Provisions
| Instrument | Threshold | Status |
|---|---|---|
| Air Quality Standards Regulations 2010 | 40 µg/m³ annual average | within limits |
| Air Quality Standards Regulations 2010 | 50 µg/m³ 24-hour average (not to be exceeded more than 35 times a year) | within limits |
| Air Quality Standards Regulations 2010 | 20 µg/m³ annual average | within limits |
| World Health Organisation Air Quality Guidelines | Considerably lower than UK legal limit (for PM2.5 annual mean); No safe limit for PM2.5 exposure | cannot determine |
Ammonia (NH₃)
NH₃ concentration time-series.
Static image
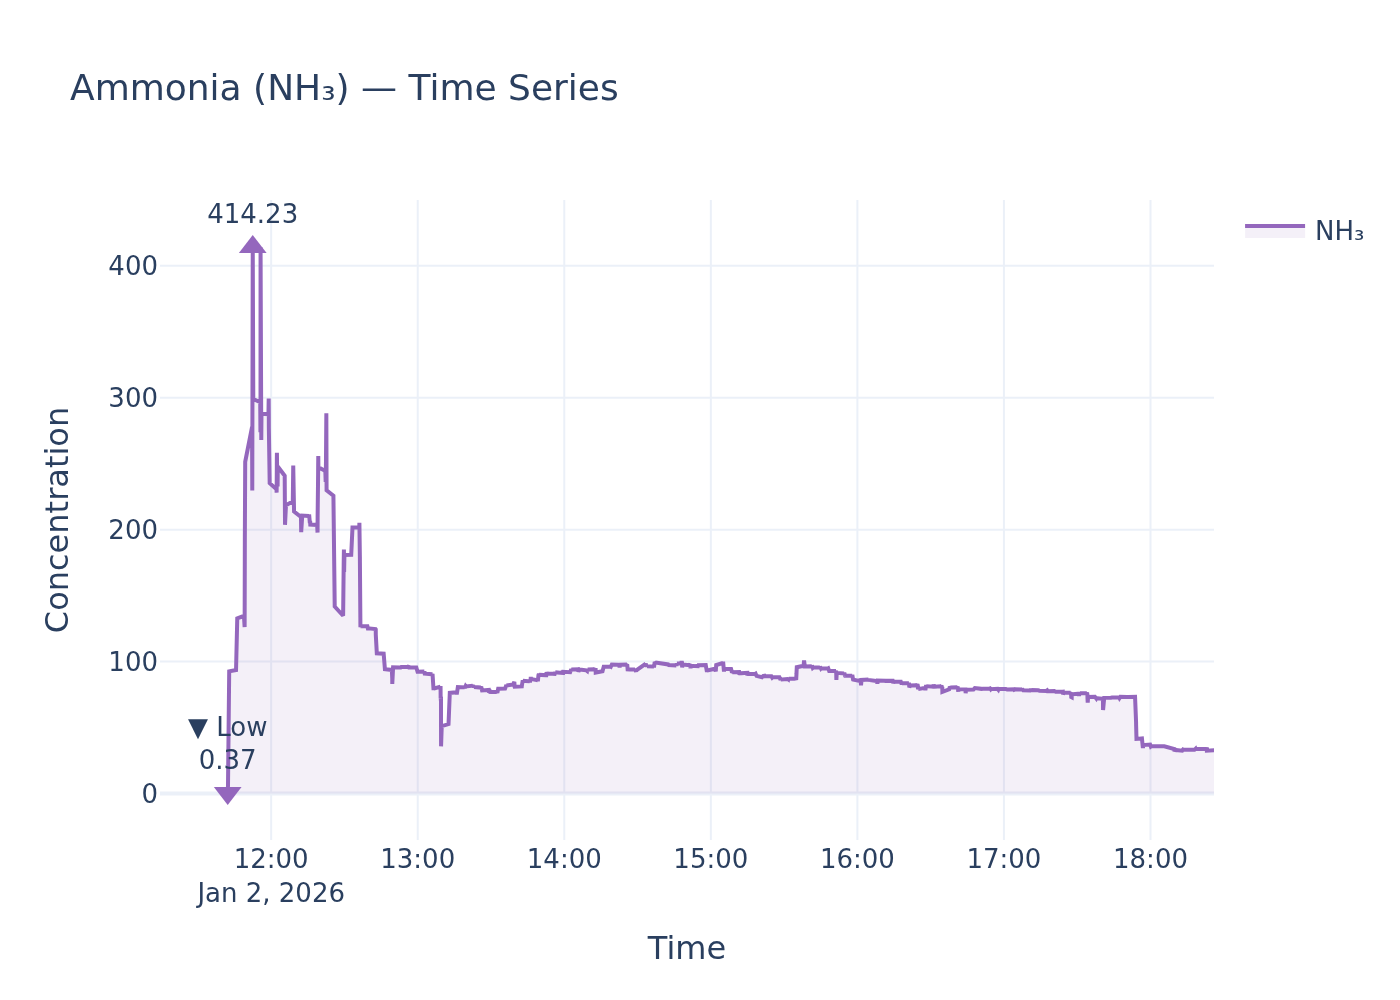
Ammonia Readings Highlight Ecological Risk as UK Policy Lacks Direct Ambient Air Quality Limits for Human Health
Environmental sensor data reveals ammonia (NH₃) levels fluctuating significantly, with a peak reading of 414.23 units, a low of 0.37 units, and an average concentration of 100.85 units.
Findings
While the provided sensor readings indicate varying levels of ammonia, current UK environmental policy documents, including the National Emission Ceilings Regulations (NECR) 2018, primarily focus on national emission reduction commitments for ammonia rather than establishing specific ambient air quality limits directly applicable to these sensor measurements for human health. Therefore, a direct comparison against UK legal limits or WHO guidelines for ambient ammonia concentrations for human health protection cannot be made based on the retrieved policy. However, policy documents do highlight the environmental implications of ammonia, noting its direct toxicity to plants, even at low concentrations, and its role in altering plant community structures and diversity.
Analysis
Ammonia, predominantly emitted from agricultural sources such as livestock manure and fertilisers, poses a significant threat to ecosystems. Policy documents indicate that increased ammonia levels can lead to common plant species dominating habitats, displacing rarer species, and causing major shifts in plant community structure. Direct toxicity to plants, mosses, and lichens is observed even at very low concentrations. While the NECR 2018 sets national emission reduction targets, there is no explicit statutory Local Air Quality Management (LAQM) duty on local authorities to consider ammonia. This absence of specific ambient air quality standards for ammonia directly comparable to the sensor readings means that while ecological impacts are acknowledged in policy, the immediate implications for human health cannot be assessed with the provided regulatory context. The Clean Air Strategy also aims to reduce the deposition of reactive nitrogen, which includes ammonia, to sensitive sites.
Data Gaps
The retrieved policy documents do not provide specific UK legal limits or WHO guidelines for ambient ammonia (NH₃) concentrations that apply directly to human health or against which the sensor readings can be compared. Further, there are no details on the health impacts of ammonia on humans within the provided policy context, only on ecological systems. The averaging period for the sensor readings is also not specified, which would be crucial for comparison against any potential future averaged limits.
Policy Provisions
| Instrument | Threshold | Status |
|---|---|---|
| National Emission Ceilings Regulations (NECR) 2018 | Emission reduction commitments (ERCs) for anthropogenic emissions of ammonia (NH₃) by 8% by 2020 and 16% by 2030 from 2005 levels. | cannot determine |
Noise
Noise level time-series.
Static image
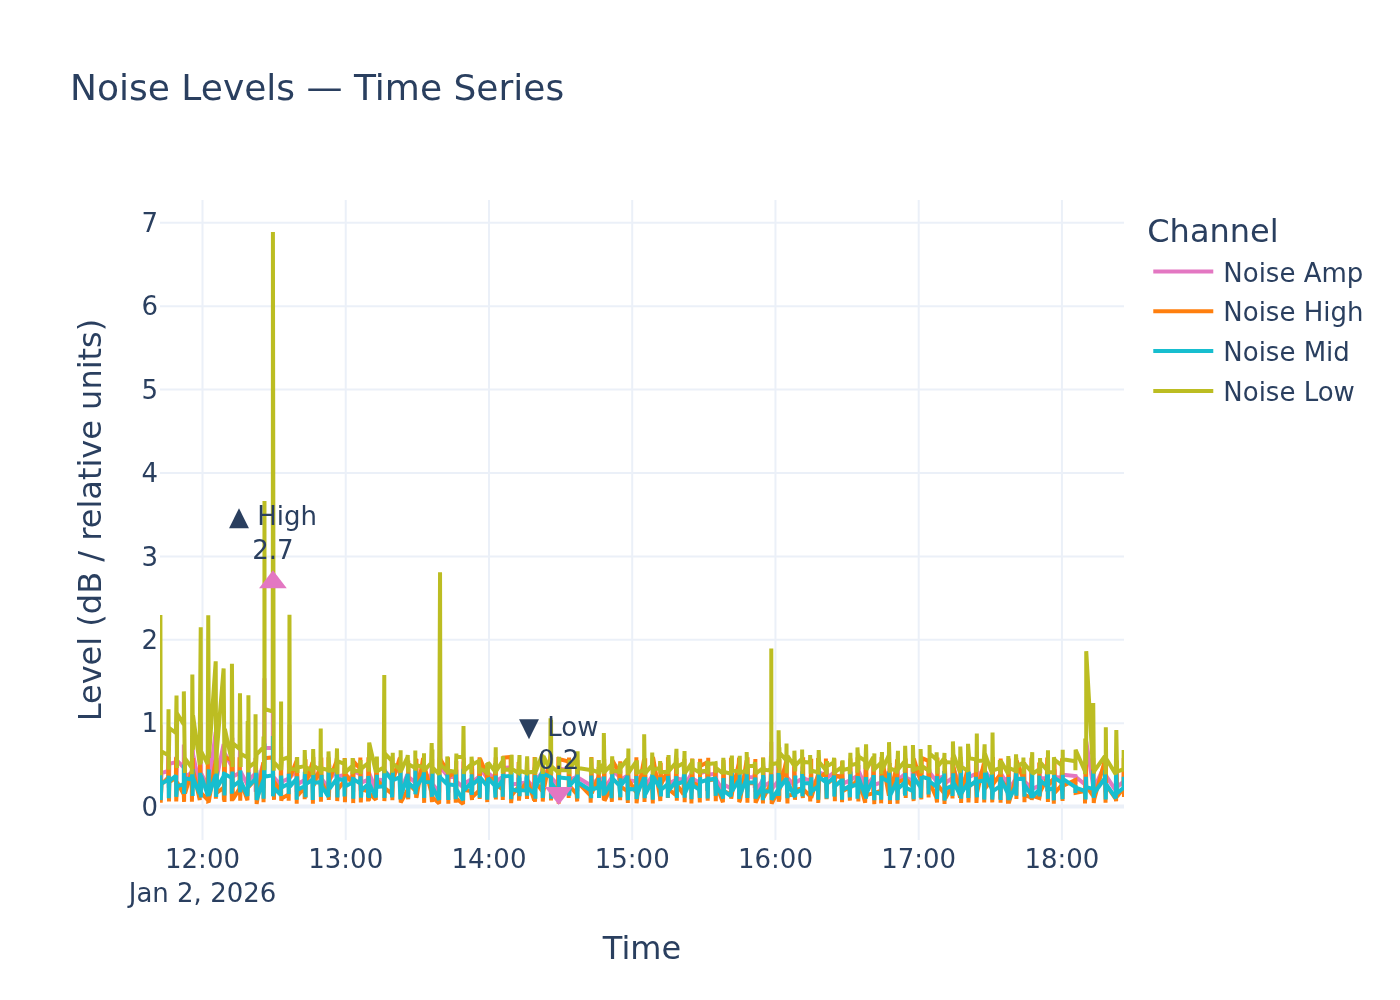
Environmental Noise Readings Lack Context for Policy Compliance Assessment
An environmental noise sensor recorded a high of 2.7, a low of 0.2, and a mean of 0.3 in relative noise units. Without defined policy thresholds and unit conversions, these readings cannot be assessed against UK or WHO environmental noise standards.
Findings
The provided noise levels, reported as a high of 2.7, a low of 0.2, and a mean of 0.3 in 'relative noise units,' cannot be compared against UK legal limits or WHO environmental noise guidelines. The retrieved policy documents, specifically the WHO Environmental Noise Guidelines for the European Region, refer to noise indicators such as Lden and Lnight, which are standard metrics for environmental noise, but do not provide specific numerical thresholds in decibels (dB) for these indicators. Crucially, the policy documents do not define or reference 'relative noise units,' making a direct comparison with established environmental noise standards impossible. Therefore, it is not possible to determine if these readings exceed or fall within any official limits or guidelines, nor to calculate any margin of exceedance or compliance.
Analysis
The World Health Organization (WHO) has developed Environmental Noise Guidelines for the European Region to protect human health from various sources of environmental noise, including road traffic, railway, aircraft, wind turbine, and leisure noise. These guidelines are designed to inform policy-making by Member States and are compatible with noise indicators used in the EU's Environmental Noise Directive (END), such as Lden and Lnight. While the intent is to guide the reduction of noise pollution towards WHO-recommended levels, the specific decibel thresholds for these recommendations were not found in the policy search. Without these numerical thresholds and a clear conversion or definition for 'relative noise units,' it is impossible to assess the health implications or legal duties associated with the reported noise levels. Authorities are typically obligated to monitor and manage noise levels to protect public health, but without quantifiable standards for comparison, the current data remains uninterpretable in a regulatory context.
Data Gaps
A significant data gap exists in the absence of specific numerical noise limits or thresholds from both UK policy guidance and WHO environmental noise guidelines. The retrieved documents do not provide the actual decibel values for recommended Lden or Lnight levels. Furthermore, the term 'relative noise units' is not defined within the searched policy documents, making it impossible to convert the provided readings into a standard unit (e.g., decibels) that can be compared against established limits. Information on specific UK national noise legislation and its comparison with WHO guidelines is also missing, which would be crucial for a comprehensive assessment of compliance and implications.
Sample ID: samples_16851a7b_3c17_4c3d_ab05_570d80a54ac4