Environmental sensor data for 15 Apr 2026, 06:36–07:02 — 216 readings, covering approximately 1.7 km.
Location Map
Particulate Matter (PM)
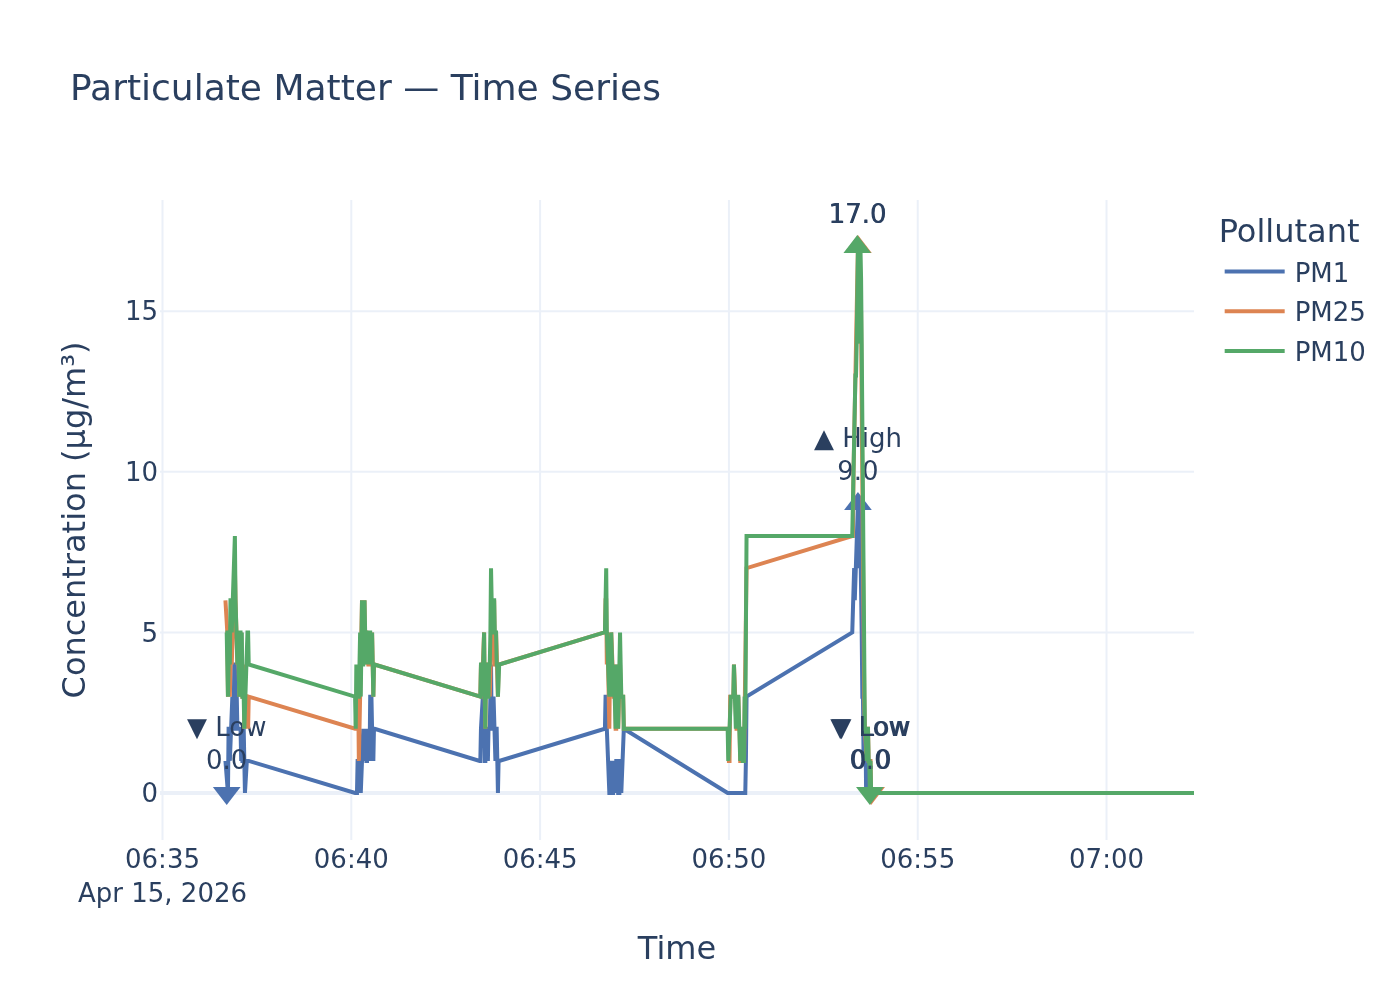
Time-series for PM1, PM2.5, and PM10.
Static image
Particulate Matter Levels Well Below UK Legal Limits, Though WHO Warns No Safe Exposure Limit for PM2.5
An environmental sensor recorded particulate matter concentrations during a sampling session, revealing mean PM1 levels at 1.5 µg/m³, PM2.5 at 3.9 µg/m³, and PM10 at 4.1 µg/m³. Peak readings reached 9.0 µg/m³ for PM1 and 17.0 µg/m³ for both PM2.5 and PM10.
Findings
The particulate matter readings indicate air quality well within current UK legal limits for both PM10 and PM2.5. The highest recorded PM10 concentration of 17.0 µg/m³ and the mean of 4.1 µg/m³ are significantly below the UK's 24-hour mean limit of 50 µg/m³ (not to be exceeded more than 35 times a year) and the annual mean limit of 40 µg/m³, as mandated by The Air Quality Standards Regulations 2010. Similarly, the peak PM2.5 reading of 17.0 µg/m³ and the mean of 3.9 µg/m³ remain comfortably beneath the UK's annual mean limit of 20 µg/m³ for PM2.5, established by the same regulations.
While specific numeric WHO guideline values for PM2.5 and PM10 are not fully detailed in the retrieved policy documents, it is noted that the 2021 WHO guidelines are ‘more stringent’ than previous iterations, with the WHO considering ’there to be no safe limit of exposure to PM2.5, and any reduction in PM2.5 leads to positive health outcomes.’ The WHO also recommends ‘a considerably lower level for annual mean PM2.5 concentration than the pre-existing legal limit in the UK (20 μg/m3)’. Given the mean PM2.5 reading of 3.9 µg/m³, these levels are likely closer to, or within, more stringent WHO recommendations, although the peak of 17.0 µg/m³ might still exceed some hypothetical stricter short-term WHO guidelines if they were available.
There are no specific UK air quality policy limits or WHO guidelines provided for PM1 in the retrieved documents.
Analysis
While the reported particulate matter levels fall comfortably within current UK legal standards, the World Health Organisation's stance on PM2.5 underscores a critical environmental health perspective. PM2.5, due to its ability to 'penetrate deeply into the lungs' and 'enter the bloodstream,' is a significant concern for human health. Short-term exposure at elevated concentrations can exacerbate pre-existing respiratory and cardiovascular conditions, particularly affecting the elderly and children. Long-term exposure carries more severe implications, linking to conditions such as 'respiratory and cardiovascular disease, cancer and dementia.' The WHO's assertion that 'there is no safe limit of exposure to PM2.5' highlights that even levels below legal thresholds can pose health risks, advocating for continuous efforts to reduce concentrations. The observed mean PM2.5 concentration of 3.9 µg/m³ is notably low compared to the UK's 20 µg/m³ annual mean limit, suggesting a relatively good air quality scenario at the time and location of sampling, in line with the UK's interest to 'measure concentrations of PM as close to these sources of anthropogenic emissions as possible in order to effectively assess exposure to PM that can be tackled via UK policies.'
Data Gaps
The assessment is limited by the absence of specific numeric values for the 2021 WHO Air Quality Guidelines for PM2.5 and PM10 in the retrieved policy documents, which would allow for a more precise comparison. Furthermore, the provided data represents a snapshot (high, low, mean) from a single sampling session; continuous monitoring over the full 24-hour and annual averaging periods would be necessary for definitive compliance assessment against UK legal limits and comprehensive comparison with long-term WHO guidelines. No specific UK policy limits or WHO guidelines for PM1 were found in the provided policy context.
Policy Provisions
| Instrument | Threshold | Status |
|---|---|---|
| Air Quality Standards Regulations 2010 (as referenced in Particulate matter (PM10_PM2.5) - GOV.UK.pdf) | PM10: 40 µg/m³ annual mean; 50 µg/m³ 24-hour mean (not to be exceeded more than 35 times a year). PM2.5: 20 µg/m³ annual mean. | within limits |
| World Health Organisation (2021) WHO global air quality guidelines (referenced in city-of-london-air-quality-strategy-2025-2030.pdf and LAQM-Policy-Guidance-2022.pdf) | Not numerically specified in retrieved documents; described as 'considerably lower' for PM2.5 annual mean than UK limit, and 'no safe limit' for PM2.5. | cannot determine |
Ammonia (NH₃)
NH₃ concentration time-series.
Static image
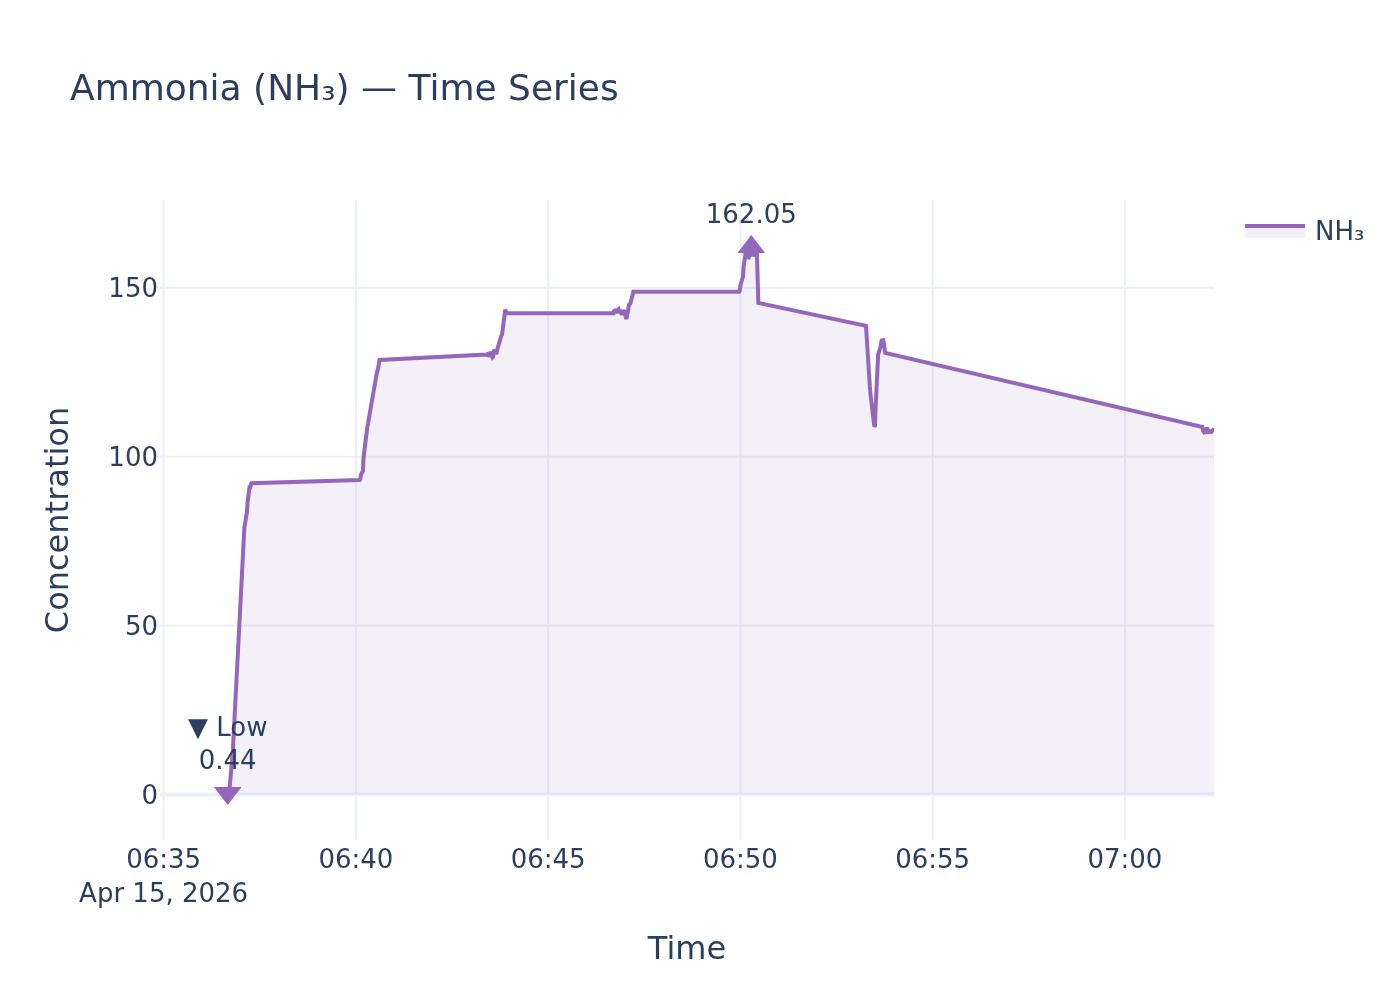
Ammonia levels spike at 162.05, exceeding documented environmental impact thresholds, but specific UK ambient limits remain undefined for direct comparison.
An environmental sensor recorded ammonia (NH₃) readings with a high of 162.05, a low of 0.44, and a mean of 117.51. The precise location and date of these readings were not provided, limiting the ability to ground the report in a specific time and place.
Findings
While the sensor recorded ammonia concentrations reaching a peak of 162.05 and a mean of 117.51, a direct comparison against UK legal limits or World Health Organization (WHO) guidelines for ambient ammonia concentrations cannot be made. This is because the available policy documents, including the LAQM Policy Guidance 2022 and the National Emission Ceilings Regulations (NECR) 2018, do not specify numerical thresholds for ambient ammonia concentrations that would trigger a breach. Instead, policy focuses on emission reduction targets, such as an 8% reduction from 2005 levels by 2020 and a 16% reduction by 2030, and a 17% reduction in the deposition of reactive nitrogen to sensitive sites by 2030. Therefore, while the recorded high and mean values are significant, their compliance status against a statutory limit remains undetermined.
Analysis
The elevated ammonia readings, particularly the high of 162.05, are cause for concern given the documented environmental impacts. Policy documents indicate that increasing ammonia levels can lead to significant changes in plant community structure, with common species dominating at the expense of rarer ones, subsequently affecting associated animal species. Ammonia is also directly toxic to plants, with some species of moss and lichen being impacted at even very low concentrations. The vast majority of UK ammonia emissions, approximately 88%, originate from agricultural sources, including livestock manure, urine, and inorganic fertilisers. While the National Emission Ceilings Regulations (NECR) 2018 set emission reduction commitments for ammonia, there is no direct statutory duty for local authorities to monitor or regulate ambient ammonia concentrations under the Local Air Quality Management (LAQM) framework. This creates a gap between emission reduction targets and direct ambient air quality standards for ammonia, leaving the public and environmental bodies without clear benchmarks to assess immediate exposure levels against statutory limits.
Data Gaps
The current assessment is limited by the absence of specific UK legal limits or WHO guidelines for ambient ammonia concentrations that could be directly compared to the sensor readings. Furthermore, the lack of information regarding the precise location and date of the sensor readings prevents a more granular analysis of potential local sources or temporal trends. Information on health impacts of ammonia at these specific concentrations was also not detailed within the retrieved policy documents, beyond a general mention of 'Health impacts' in a document's contents.
Policy Provisions
| Instrument | Threshold | Status |
|---|---|---|
| LAQM Policy Guidance 2022 | 8% reduction in emissions from 2005 levels by 2020; 16% by 2030. | cannot determine |
| LAQM Policy Guidance 2022 | 17% reduction in the deposition of reactive nitrogen to priority, protected sensitive sites in England by 2030. | cannot determine |
| LAQM Policy Guidance 2022 | No statutory LAQM duty on local authorities to consider ammonia. | cannot determine |
Noise
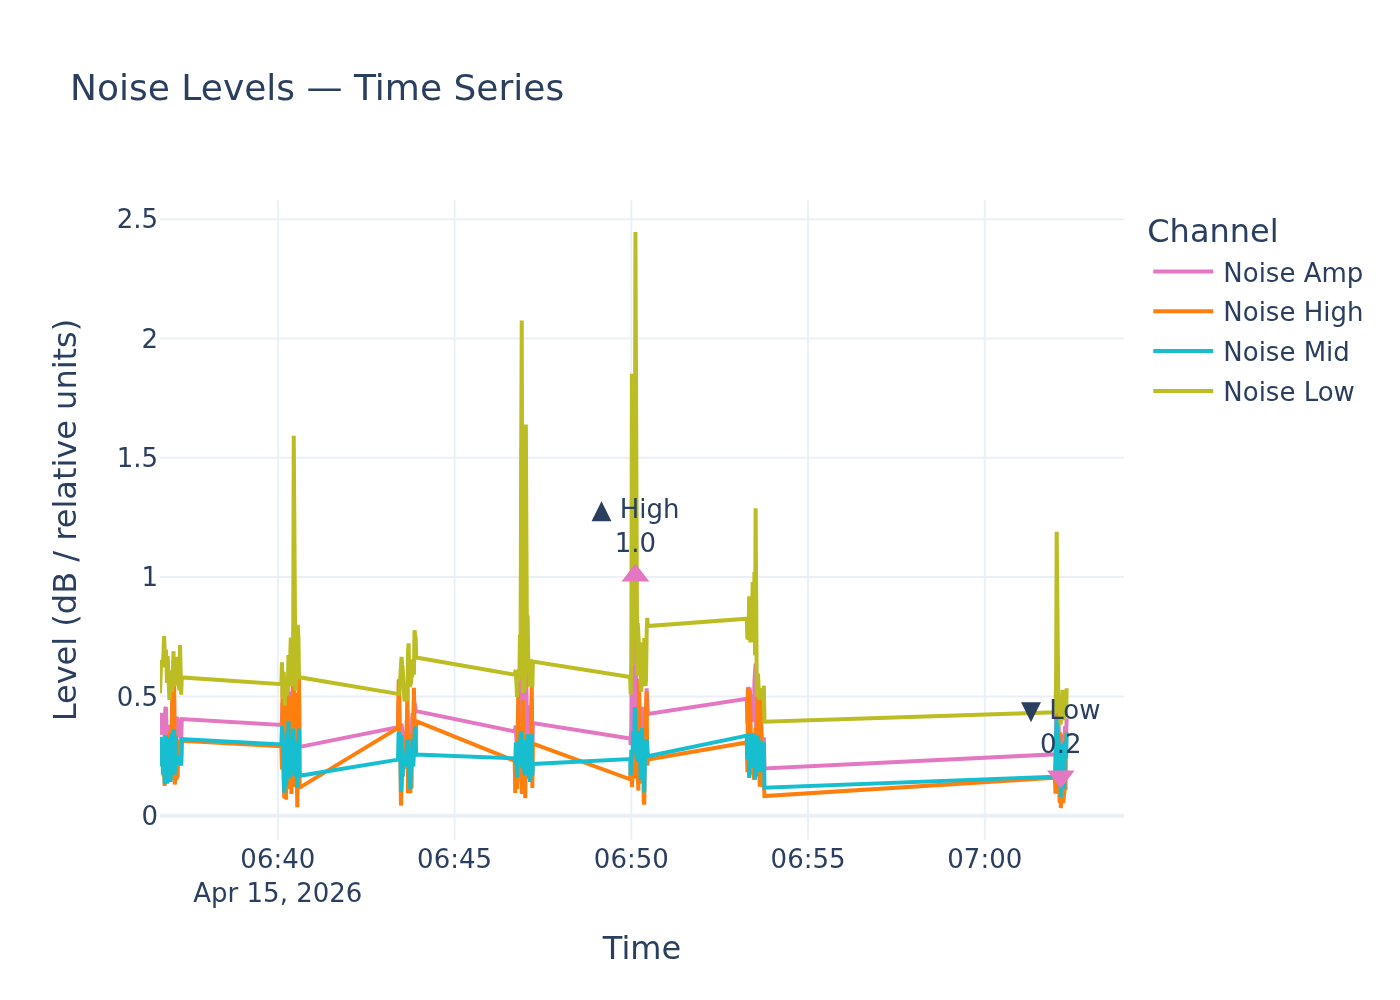
Noise level time-series.
Static image
Lack of Standardised Units Prevents Direct Comparison of Reported Noise Levels with UK and WHO Guidelines
An environmental noise sensor recorded a high of 1.0, a low of 0.2, and a mean of 0.4 relative noise units. However, these units cannot be directly assessed against established UK or World Health Organization (WHO) environmental noise thresholds.
Findings
The provided noise measurements, expressed in 'relative noise units,' cannot be quantitatively compared against UK legal limits or WHO guidelines. While the UK's Noise Policy Statement for England and the WHO's environmental noise guidelines aim to mitigate and manage noise for public health, the specific numerical thresholds and averaging periods cited in these policies are expressed in standard decibel (dB) measurements, not relative units. Therefore, it is impossible to determine if the reported levels exceed, fall within, or align with any published environmental noise standards.
Analysis
The UK government's policy on noise, articulated in the Noise Policy Statement for England, aims to promote good health and quality of life by avoiding and mitigating significant adverse impacts from noise. This policy framework underpins the implementation of the Environmental Noise Directive, which mandates strategic noise mapping and the development of noise Action Plans. The WHO also provides environmental noise guidelines for the European Region, proposing public health recommendations to protect against exposure to noise from various sources, including transport and leisure. These guidelines guide the revision of Annex III of the EU's END and inform European environment policy, which is committed to reducing noise pollution to 'WHO-recommended levels.' However, without converting the 'relative noise units' into standard decibel measurements, assessing the health implications or legal duties arising from the reported levels remains unfeasible. Long-term exposure to high levels of environmental noise is associated with illnesses like heart attacks and strokes.
Data Gaps
The crucial missing data point is the conversion factor or definition for 'relative noise units' to a standard unit of measurement, such as decibels (dB), which is used in UK and WHO environmental noise guidelines. Without this conversion, a direct comparison to established policy thresholds is not possible. The retrieved policy documents also do not provide specific numerical limits or guidelines in 'relative noise units' for comparison.
Sample ID: samples_45cdb2d7_a1b6_4605_b05a_2dd46ba7c3df