Environmental sensor data for 1 Jan–6 Jan 2026 — 8,202 readings, covering approximately 53.2 km.
Location Map
Particulate Matter (PM)
Time-series for PM1, PM2.5, and PM10.
Static image
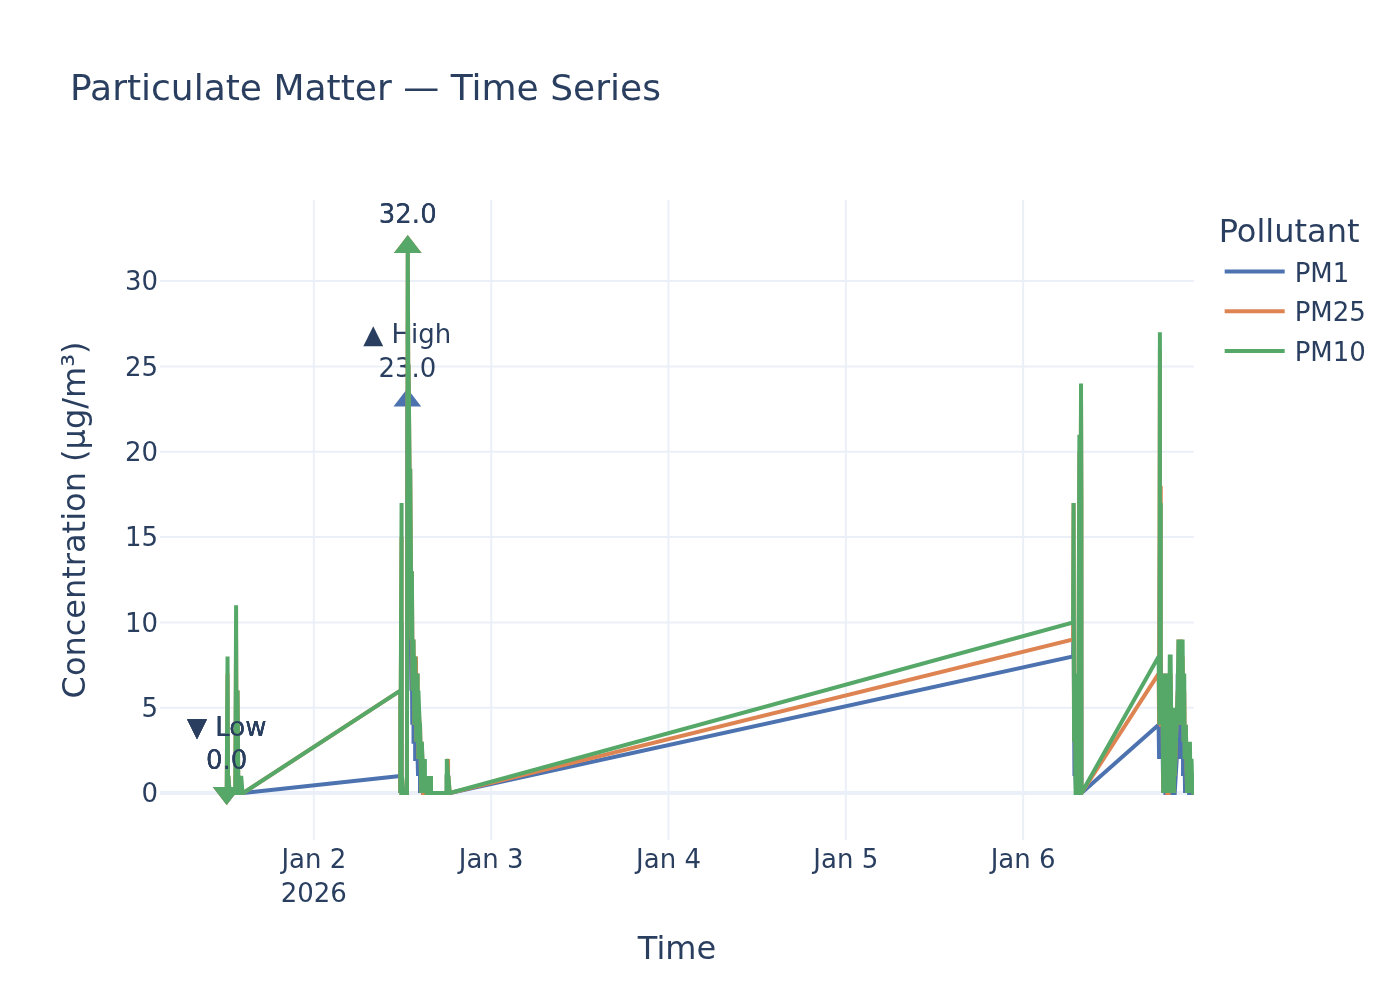
Particulate Matter Levels Significantly Below UK Legal Limits, But Approach WHO Guidelines for PM2.5
An environmental sensor recorded particulate matter levels, showing a mean PM1 concentration of 1.7 µg/m³, PM2.5 at 2.8 µg/m³, and PM10 at 2.9 µg/m³ during a sampling session.
Findings
Analysis of the environmental sensor data reveals that all reported mean particulate matter levels are well within the current UK legal limits for PM10 and PM2.5. However, when compared against the stricter World Health Organization (WHO) 2021 guidelines, the PM2.5 mean concentration of 2.8 µg/m³ is notably closer to the recommended annual guideline. There are no specific UK legal limits or WHO guidelines provided in the retrieved documents for PM1.
Analysis
The observed mean concentrations of PM10 and PM2.5 are significantly below the statutory limits outlined in the Air Quality Standards Regulations 2010. For PM10, the mean reading of 2.9 µg/m³ is well below the annual average limit of 40 µg/m³. Similarly, the mean PM2.5 concentration of 2.8 µg/m³ is substantially lower than the UK's annual average limit of 20 µg/m³. This indicates good compliance with current UK legal obligations based on these mean figures.
However, a crucial distinction emerges when considering the more stringent WHO 2021 Global Air Quality Guidelines. While the PM10 mean of 2.9 µg/m³ remains considerably below the WHO annual mean guideline of 15 µg/m³, the PM2.5 mean of 2.8 µg/m³ is only 44% below the WHO’s recommended annual mean of 5 µg/m³. This highlights that while legally compliant in the UK, there is still scope for improvement to align with best practice international health recommendations. The Environmental Targets (Fine Particulate Matter) (England) Regulations (2023) set a future target of 10 µg/m³ for PM2.5 by 2040, which the current readings comfortably meet, suggesting progress towards this long-term goal.
From an environmental health perspective, the WHO considers there to be no safe limit of exposure to PM2.5, and any reduction leads to positive health outcomes. Therefore, while these readings are low, sustained efforts to further reduce PM2.5 concentrations are beneficial. Particulate matter, particularly fine particles like PM2.5, can penetrate deep into the respiratory system and cause significant health issues, including respiratory and cardiovascular diseases. The primary sources of particulate matter in the UK include domestic wood burning and wear from vehicle tyres and brakes, making localised monitoring and policy interventions critical for effective exposure reduction.
Data Gaps
The provided data consists of mean values, and without specified averaging periods (e.g., daily, monthly, annual), a direct comparison against UK 24-hour mean limits (e.g., PM10 not to exceed 50 µg/m³ more than 35 times a year) or WHO 24-hour guidelines is not fully possible. The absence of specific dates or a location also limits the ability to ground the findings in a precise geographical and temporal context. Furthermore, the retrieved policy documents do not contain specific UK or WHO guidelines or limits for PM1, which would allow for a comprehensive assessment of that pollutant.
Policy Provisions
| Instrument | Threshold | Status |
|---|---|---|
| Air Quality Standards Regulations 2010 | 40 µg/m³ (PM10) | within limits |
| WHO Global Air Quality Guidelines (2021) | 15 µg/m³ (PM10) | within limits |
| Air Quality Standards Regulations 2010 | 20 µg/m³ (PM2.5) | within limits |
| The Environmental Targets (Fine Particulate Matter) (England) Regulations (2023) | 10 µg/m³ (PM2.5) by 31 December 2040 | within limits |
| WHO Global Air Quality Guidelines (2021) | 5 µg/m³ (PM2.5) | within limits |
Ammonia (NH₃)
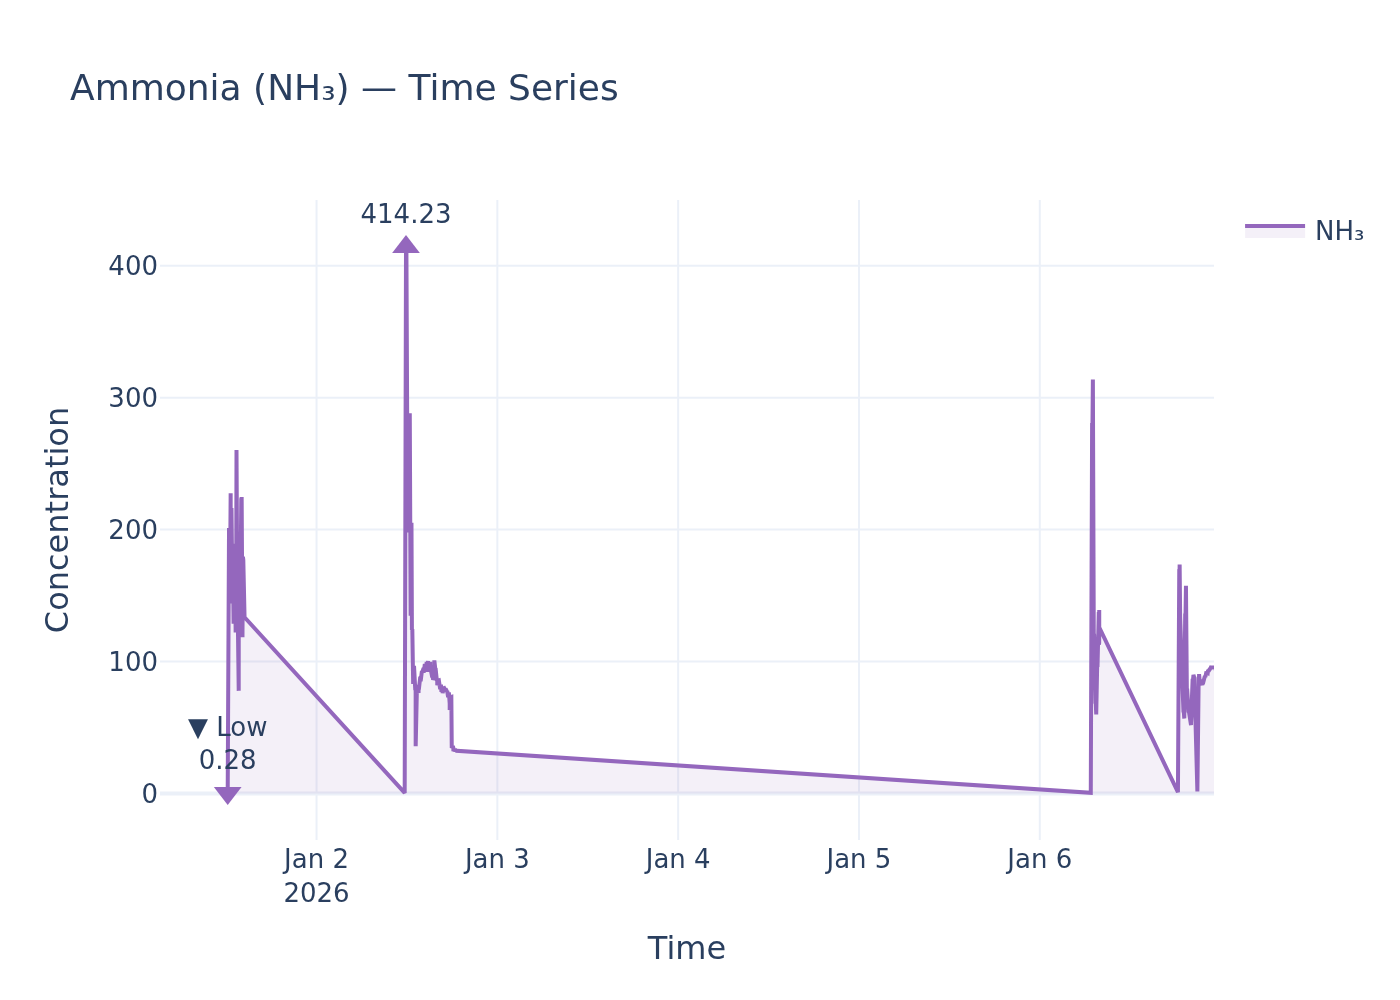
NH₃ concentration time-series.
Static image
Ammonia Readings Show Significant Levels, But UK Lacks Specific Ambient Air Quality Limits for Direct Comparison
An environmental sensor recorded ammonia (NH₃) readings with a high of 414.23, a low of 0.28, and a mean of 108.50. These measurements indicate a wide range of ammonia concentrations at the monitoring location.
Findings
While the sensor data provides specific ammonia concentrations, current UK environmental policy documents do not establish statutory ambient air quality limits for ammonia (NH₃) to which these readings can be directly compared. The Local Air Quality Management (LAQM) framework, for instance, places "no statutory LAQM duty on local authorities to consider ammonia" [6]. Consequently, it is not possible to determine if the recorded high of 414.23, low of 0.28, or mean of 108.50 µg/m³ (assuming standard units of concentration) are in exceedance of any legal thresholds for public exposure.
Analysis
Although direct ambient air quality limits for ammonia are absent in the provided policy context, the UK does have national emission reduction commitments. The National Emission Ceilings Regulations (NECR) (2018) set emission reduction commitments for ammonia, among other pollutants, to be met between 2020-2029 and from 2030 onwards [5]. Furthermore, statutory targets include an 8% reduction in emissions from 2005 levels by 2020 and a 16% reduction by 2030, alongside a target to reduce the deposition of reactive nitrogen to sensitive sites by 17% by 2030 [6].
The environmental implications of ammonia are significant, particularly for ecosystems. Ammonia is directly toxic to plants, with some species of moss and lichen being affected even at very low concentrations. Increased ammonia levels can lead to common plant species dominating habitats, reducing biodiversity and impacting associated animal species [2]. The vast majority of ammonia emissions in the UK, approximately 88%, originate from agricultural sources, primarily livestock manure, urine, and inorganic fertilisers [6]. While the policy documents generally mention ‘health impacts’ [4], they do not elaborate on specific health risks associated with ambient ammonia concentrations for human populations, nor do they provide a health-based standard for comparison to the sensor readings.
Data Gaps
A key data gap is the absence of specific UK legal ambient air quality limits or WHO guidelines for ammonia (NH₃) concentrations that would allow for a direct comparison with the sensor readings. While emission reduction targets and ecological impacts are detailed, clear health-based thresholds for public exposure to ambient ammonia are not present in the retrieved policy documents. Further information on the specific units of measurement for the sensor readings (e.g., µg/m³, ppb) would also refine the assessment, although the primary limitation remains the lack of comparative standards.
Policy Provisions
| Instrument | Threshold | Status |
|---|---|---|
| LAQM Policy Guidance 2022 | No statutory LAQM duty | cannot determine |
Noise
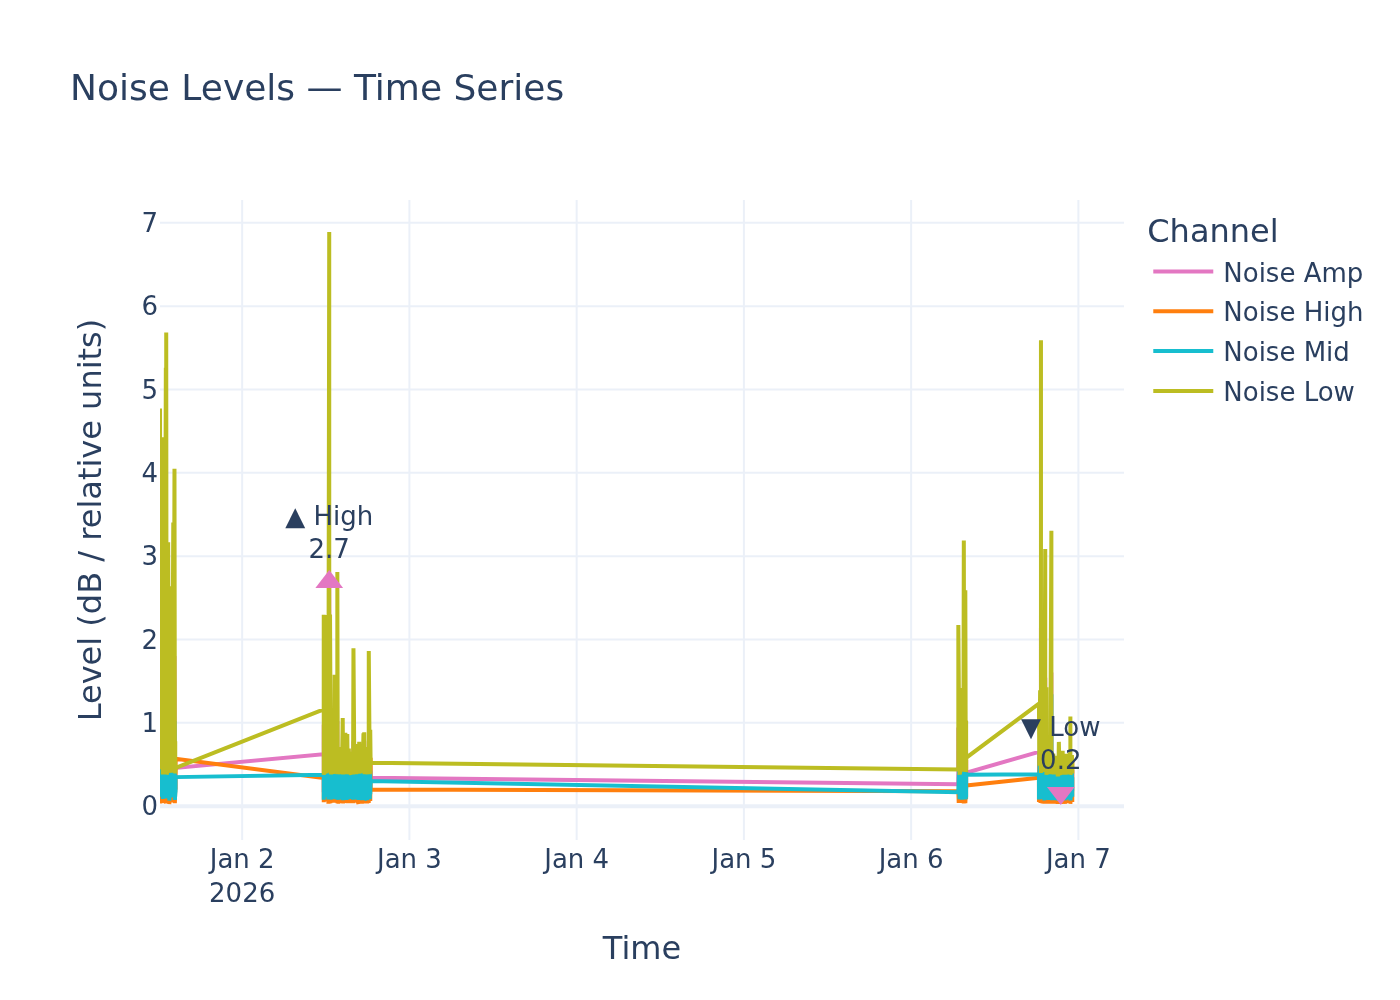
Noise level time-series.
Static image
Environmental Noise Readings in 'Relative Units' Cannot Be Judged Against UK or WHO Standards Due to Unspecified Measurement Scale
An environmental noise sensor has registered levels with a high of 2.7, a low of 0.2, and a mean of 0.4, all reported in 'relative noise units'. The specific location and time of these measurements were not provided.
Findings
While the World Health Organization (WHO) has developed comprehensive 'Environmental Noise Guidelines for the European Region' to address the significant public health impact of noise, the provided readings in 'relative noise units' cannot be directly compared to either UK legal limits or WHO guidelines. These official standards and recommendations consistently use standard decibel (dB) measurements, often employing indicators such as Lden (an average sound pressure level over all days, evenings, and nights in a year), Lnight (the equivalent continuous sound pressure level during the night), or LAeq,T (the A-weighted, equivalent continuous sound pressure level over a stated time interval). Without a conversion or definition of 'relative noise units' into a recognised sound pressure level, it is impossible to determine whether the reported levels exceed, fall within, or even approach established thresholds for environmental noise.
Analysis
The World Health Organization (WHO) consistently highlights environmental noise as a critical public health issue, acknowledging its negative impacts on human health and well-being. The WHO Regional Office for Europe's guidelines provide robust public health advice, underpinned by evidence, to drive policy action protecting communities from adverse noise effects. This underscores the importance of monitoring and regulating noise levels. However, without measurements expressed in standard decibel units, or a clear methodology for interpreting 'relative noise units', local authorities and public health bodies are unable to assess the potential health implications for the area or determine any legal duties that might arise from such readings. Effective environmental health policy relies on consistently measurable and comparable data.
Data Gaps
A critical data gap exists regarding the units of measurement for the reported noise levels. To provide a meaningful assessment, the noise data must be expressed in standard units, such as decibels (dB), and ideally specify the type of weighting (e.g., A-weighted) and averaging period (e.g., Lden, Lnight, or LAeq,T). Additionally, information on the specific location and the typical environmental context (e.g., urban, rural, proximity to transport infrastructure) would enhance any assessment against policy and guidelines.
Policy Provisions
| Instrument | Threshold | Status |
|---|---|---|
| WHO Environmental Noise Guidelines for the European Region | Not applicable; guidelines reference decibel (dB) measurements (e.g., Lden, Lnight, LAeq,T) not 'relative noise units'. | cannot determine |
Sample ID: samples_5b87b304_d7a3_4ca5_a5f9_d40f8796ff56