Environmental sensor data for 1 Jan–22 Feb 2026 — 10,741 readings, covering approximately 178.5 km.
Location Map
Particulate Matter (PM)
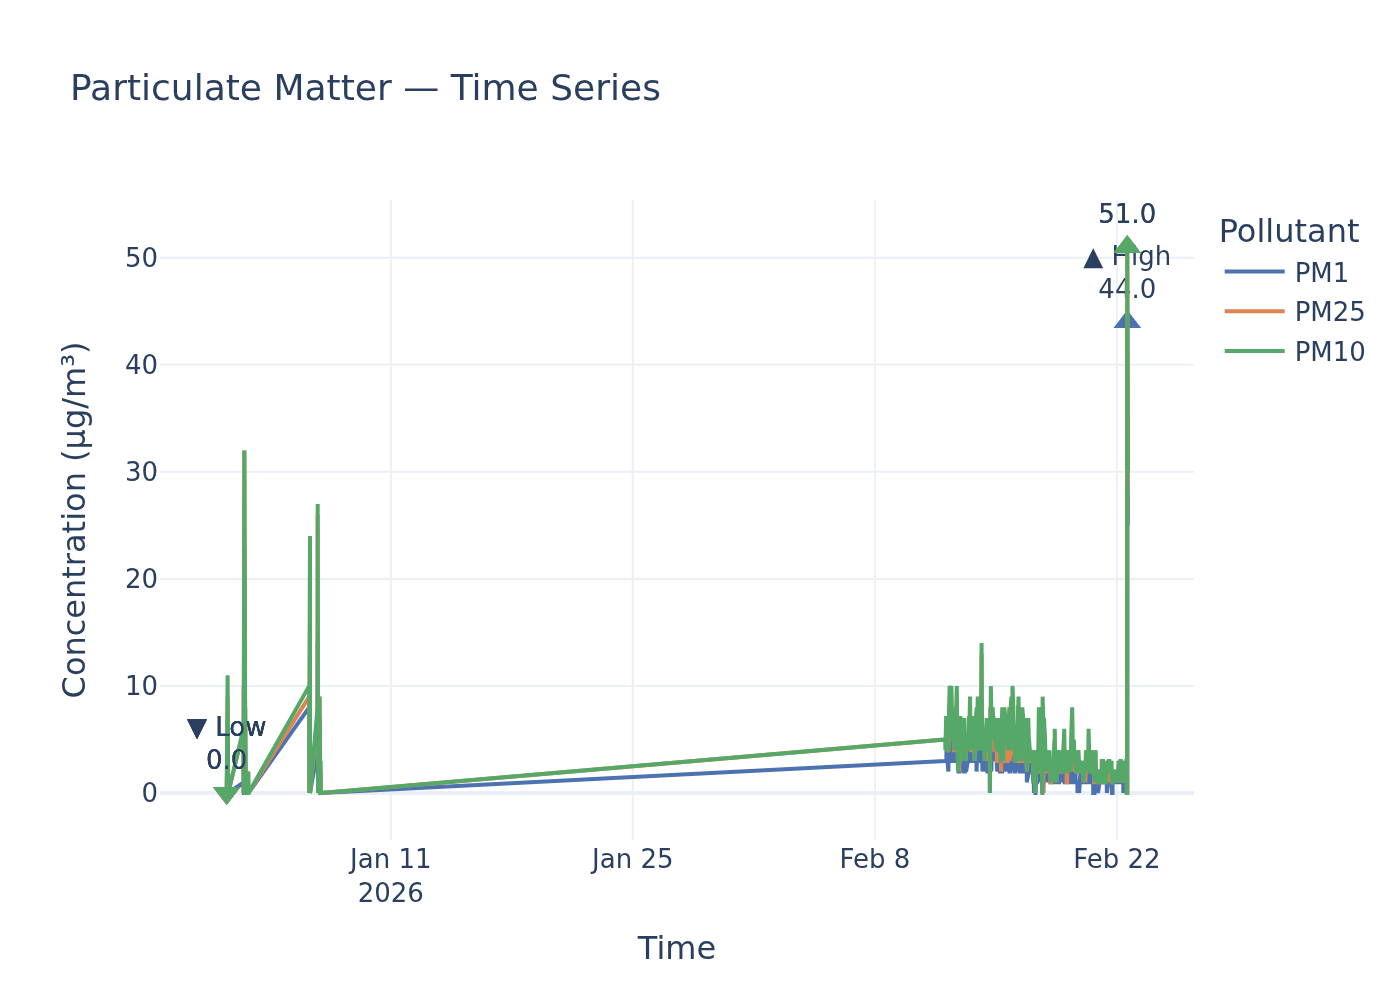
Time-series for PM1, PM2.5, and PM10.
Static image
Particulate Matter Readings Show Acute Spikes Exceeding WHO Guidelines, UK PM10 Limit Marginally Breached in Single Peak
During a recent sampling session, environmental sensor data revealed fluctuating levels of particulate matter. Measurements included PM1 with a high of 44.0 µg/m³, a low of 0.0 µg/m³, and a mean of 2.5 µg/m³; PM2.5 registered a high of 51.0 µg/m³, a low of 0.0 µg/m³, and a mean of 3.7 µg/m³; and PM10 peaked at 51.0 µg/m³, with a low of 0.0 µg/m³, and a mean of 3.9 µg/m³.
Findings
Analysis of the recorded data indicates that while the mean concentrations of both PM2.5 and PM10 generally fall within the UK's annual legal limits and the World Health Organization's (WHO) 2021 annual guidelines, acute peak concentrations reveal significant exceedances.
For PM2.5, the mean concentration of 3.7 µg/m³ is well below the UK’s annual average limit of 20 µg/m³ as mandated by the Air Quality Standards Regulations 2010. It also remains below the more stringent 2021 WHO annual guideline of 5 µg/m³. However, the recorded high of 51.0 µg/m³ dramatically surpasses the 2021 WHO 24-hour guideline of 15 µg/m³, exceeding it by 240%.
Similarly for PM10, the mean concentration of 3.9 µg/m³ is substantially lower than the UK’s annual average limit of 40 µg/m³ (Air Quality Standards Regulations 2010) and the 2021 WHO annual guideline of 15 µg/m³. The peak PM10 reading of 51.0 µg/m³ slightly exceeds the UK 24-hour mean limit of 50 µg/m³ by 2%, and also surpasses the 2021 WHO 24-hour guideline of 45 µg/m³ by 13.33%. Under UK regulations, a single exceedance of the 50 µg/m³ 24-hour mean limit for PM10 is permissible, with the standard allowing for this to occur up to 35 times in a single year before a breach is triggered.
Analysis
While the average particulate matter levels appear low, the significant spikes observed in the PM2.5 and PM10 readings are a cause for concern. The WHO considers there to be no safe limit of exposure to PM2.5, asserting that any reduction in PM2.5 concentrations leads to positive health outcomes. This underscores the importance of addressing even infrequent, high-concentration events, as they contribute to overall exposure and associated health risks.
The exceedance of the 2021 WHO 24-hour guidelines for both PM2.5 and PM10 by substantial margins during the sampling session highlights the potential for acute health impacts. Fine particulate matter (PM2.5) can penetrate deep into the lungs and enter the bloodstream, leading to respiratory and cardiovascular diseases. The UK’s current legal annual average limit for PM2.5 is four times higher than the 2021 WHO guideline, indicating a disparity in health protection standards. Although a single exceedance of the UK’s 24-hour PM10 limit does not constitute a legal breach, its occurrence alongside significant WHO guideline exceedances suggests the need for continuous monitoring and potential intervention to mitigate these pollution events. Local authorities have a duty under the Air Quality Standards Regulations 2010 to work towards achieving and maintaining air quality standards, and these spikes indicate that such efforts remain critical.
Data Gaps
A more comprehensive assessment would benefit from continuous monitoring data to establish true annual mean concentrations, rather than relying on a single sampling session's mean. Specifically, for PM10, the frequency of 24-hour mean exceedances is crucial to determine compliance with the UK's legal limit of no more than 35 exceedances per year. Additionally, the provided policy context does not specify UK or WHO limits for PM1, making a regulatory comparison for this pollutant impossible without further information.
Policy Provisions
| Instrument | Threshold | Status |
|---|---|---|
| Air Quality Standards Regulations 2010 | 20 µg/m³ annual average | within limits |
| 2021 WHO Global Air Quality Guidelines: Particulate matter (PM2.5 and PM10) | 5 µg/m³ annual mean | within limits |
| 2021 WHO Global Air Quality Guidelines: Particulate matter (PM2.5 and PM10) | 15 µg/m³ 24-hour mean | exceeded |
| Air Quality Standards Regulations 2010 | 40 µg/m³ annual average | within limits |
| Air Quality Standards Regulations 2010 | 50 µg/m³ not to be exceeded more than 35 times a year | exceeded |
| 2021 WHO Global Air Quality Guidelines: Particulate matter (PM2.5 and PM10) | 15 µg/m³ annual mean | within limits |
| 2021 WHO Global Air Quality Guidelines: Particulate matter (PM2.5 and PM10) | 45 µg/m³ 24-hour mean | exceeded |
Ammonia (NH₃)
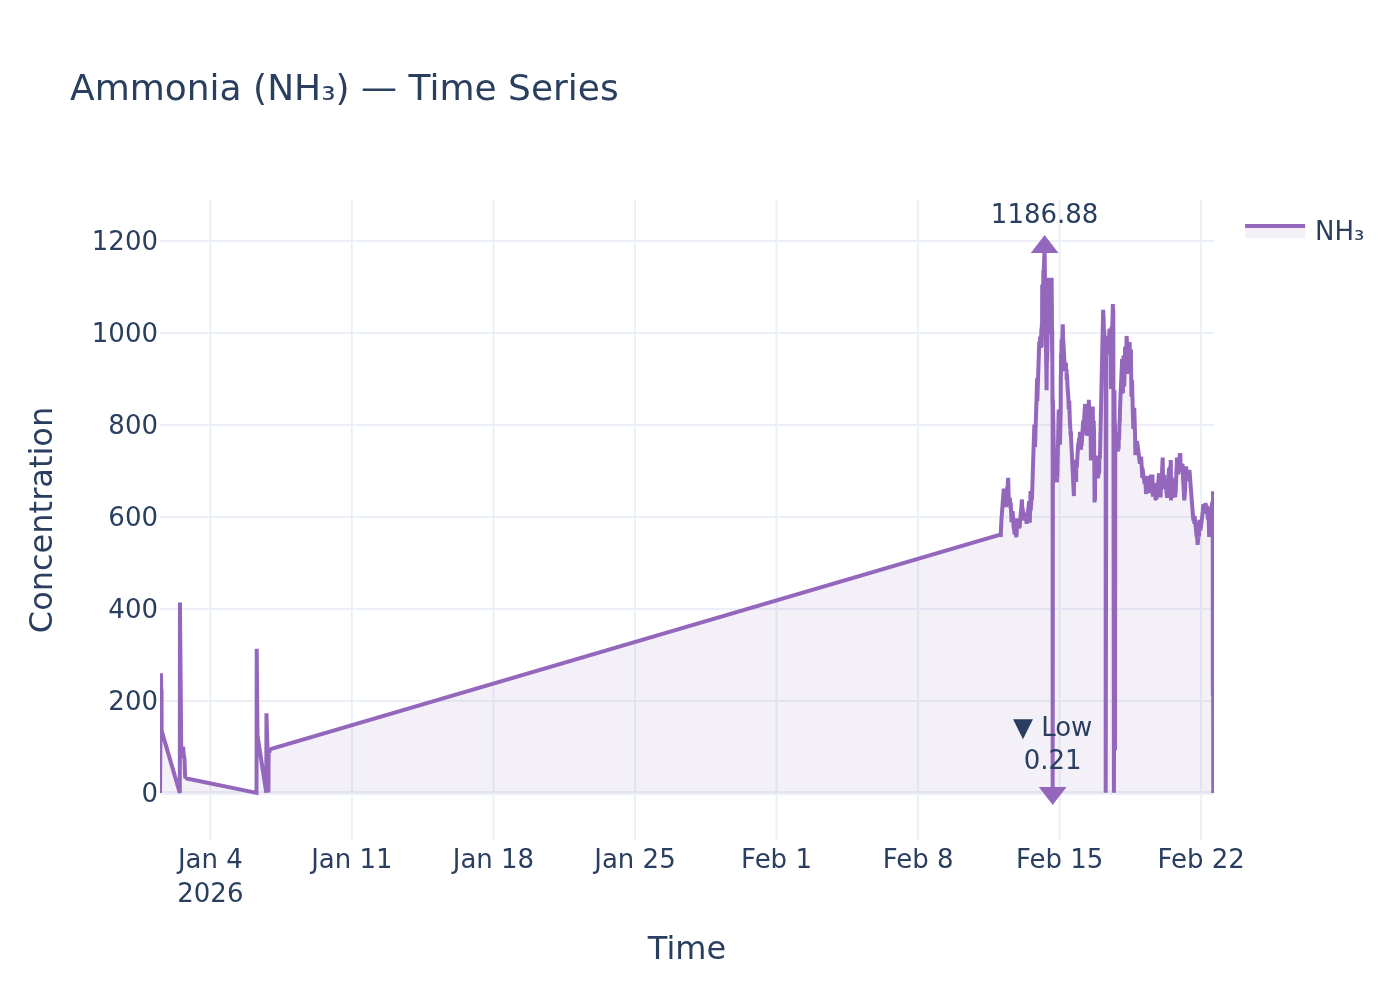
NH₃ concentration time-series.
Static image
Ammonia levels recorded with a high exceeding 1100, yet UK policy documents lack specific ambient concentration limits for direct comparison.
An environmental sensor recorded ammonia (NH₃) levels with a high of 1186.88, a low of 0.21, and a mean of 201.27. These readings provide a snapshot of local air quality concerning ammonia.
Findings
While the sensor data shows a significant peak in ammonia at 1186.88, alongside a mean of 201.27 and a low of 0.21, current UK environmental policy documents do not establish statutory ambient air quality limits for ammonia (NH₃) to which these concentrations can be directly compared. The "Local Air Quality Management (LAQM) Policy Guidance 2022" explicitly states there is no statutory LAQM duty on local authorities to consider ammonia (Source: LAQM-Policy-Guidance-2022.pdf, page 63, paragraph 10.23). Therefore, it is not possible to determine if these specific readings constitute a breach of any UK legal limit for ambient concentrations. The documents instead focus on emission reduction commitments and the ecological impacts of ammonia.
Analysis
While direct comparison to ambient concentration limits is not possible due to their absence in current policy, the environmental implications of elevated ammonia are clear. Ammonia is directly toxic to plants, with some species of moss and lichen sensitive to even very low concentrations (Source: air_pollution_uk_2024_issue_1.pdf, page 41). Elevated levels can lead to significant changes in plant community structure, allowing common species to dominate at the expense of rarer ones, thereby impacting associated animal species. The vast majority of UK ammonia emissions, approximately 88%, originate from agricultural sources, including livestock manure, urine, and inorganic fertilisers (Source: LAQM-Policy-Guidance-2022.pdf, page 63, paragraph 10.24). The UK government has set national statutory targets under the National Emission Ceilings Regulations (2018) to reduce ammonia emissions by 8% by 2020 and 16% by 2030 from 2005 levels. Additionally, the Clean Air Strategy aims to reduce the deposition of reactive nitrogen to sensitive sites by 17% by 2030. These policies reflect a focus on emission control and ecological protection rather than direct ambient concentration standards for public health in the retrieved documents.
Data Gaps
A key data gap is the absence of specific UK legal limits or WHO guidelines for ambient ammonia (NH₃) concentrations that would allow for a direct comparison with the recorded sensor readings. Furthermore, while health impacts are mentioned in a document's contents, specific details on the health implications of ammonia exposure at these levels are not provided within the retrieved policy excerpts.
Policy Provisions
| Instrument | Threshold | Status |
|---|---|---|
| LAQM Policy Guidance 2022 | No statutory ambient air quality limit for NH₃ | cannot determine |
| National Emission Ceilings Regulations (2018) | Emission reduction commitments for NH₃ (8% by 2020, 16% by 2030 from 2005 levels) | cannot determine |
| Clean Air Strategy | Target to reduce the deposition of reactive nitrogen to priority, protected sensitive sites in England by 17% by 2030 | cannot determine |
Noise
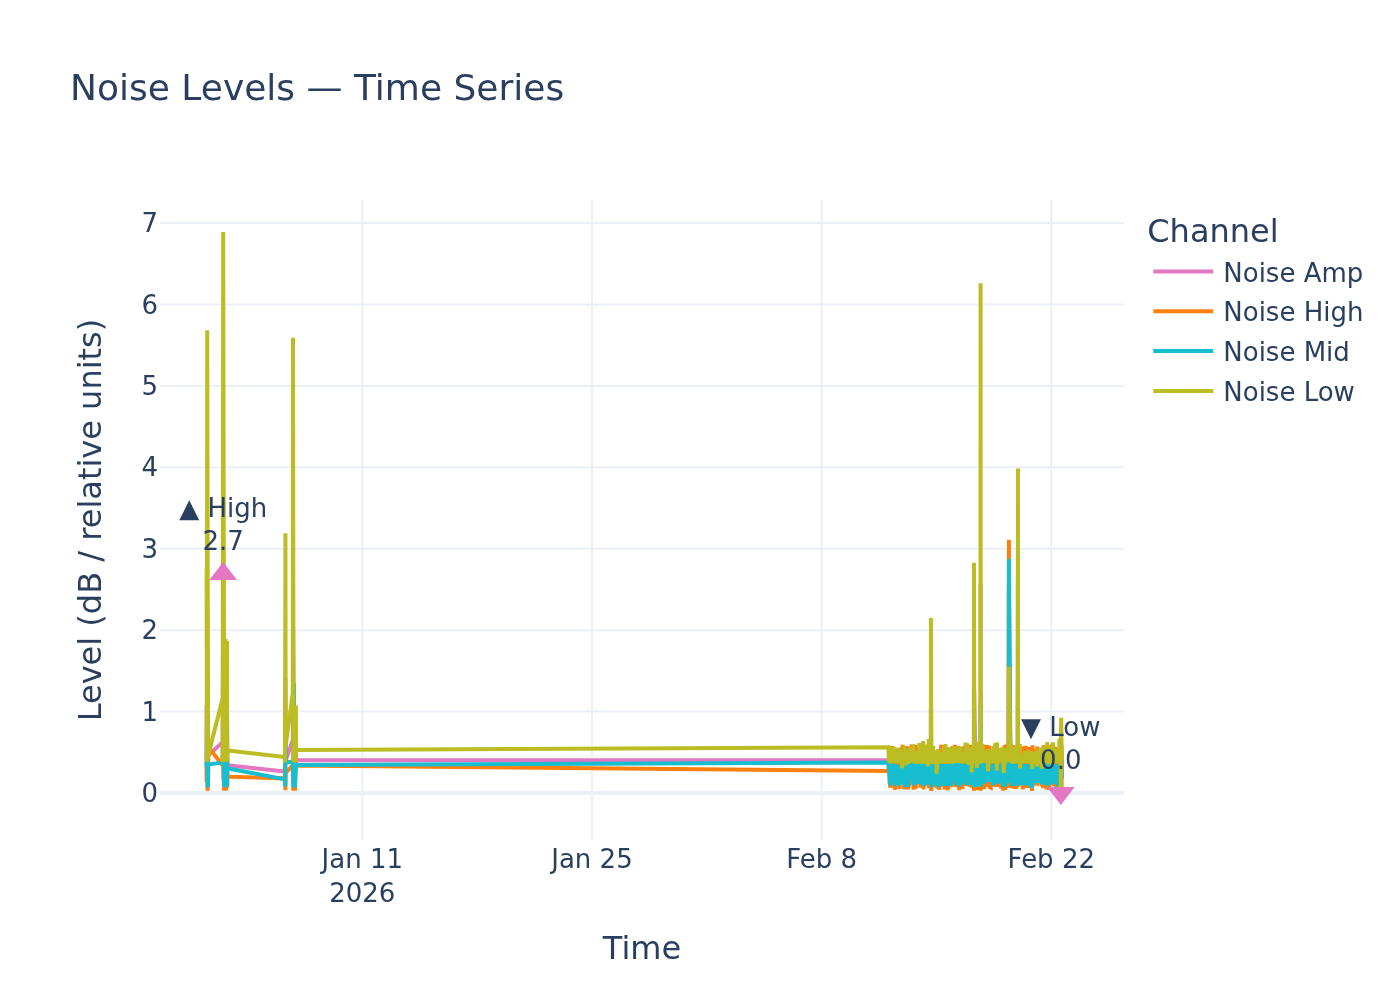
Noise level time-series.
Static image
Unspecified Noise Units Hinder Policy Comparison Amidst Calls for Health-Focused Noise Management
An environmental noise sensor recorded a high of 2.7, a low of 0.0, and a mean of 0.4, measured in unspecified 'relative noise units'. Without standard acoustic units, a direct comparison to established UK and World Health Organization (WHO) noise policy and guidelines remains impossible.
Findings
The recorded noise levels, presented in 'relative noise units', cannot be directly evaluated against the UK's Noise Policy Statement for England or WHO environmental noise guidelines. Both frameworks primarily refer to noise indicators such as Lden and Lnight, which are expressed in decibels (dB) and are standard for exposure assessment and health effect studies. The provided data lacks this crucial unit of measurement, preventing any determination of whether these levels exceed or fall within established thresholds.
Analysis
While specific comparison is unfeasible, the retrieved policy documents emphasize the importance of managing environmental noise for public health and quality of life. The WHO guidelines provide recommendations to protect human health from various noise sources, including transport, wind turbines, and leisure noise, with an aim for noise pollution to significantly decrease to WHO-recommended levels by 2020 as part of the Seventh Environment Action Programme. Similarly, the Noise Policy Statement for England aims to 'Promote good health and a good quality of life through the effective management of noise' and to 'avoid significant adverse impacts on health and quality of life.' Long-term exposure to high levels of environmental noise is linked to illnesses like heart attacks and strokes. Without a clear understanding of the units and the context of the 'relative noise units,' it is impossible to assess the potential health implications or legal duties for this specific area. Authorities are typically required to use standard noise indicators for policy-making and health assessments.
Data Gaps
A critical data gap is the lack of a defined unit for the reported noise levels. Environmental noise assessments universally rely on standard acoustic units (e.g., decibels, dB) and specific indicators (e.g., Lden, Lnight) to allow for comparison against established health guidelines and legal limits. Without this, the 'relative noise units' are uninterpretable in a policy context. Additionally, the query does not provide information on the location, date, or the specific types of noise being measured, which would be crucial for a comprehensive journalistic assessment of the scene and its implications.
Policy Provisions
| Instrument | Threshold | Status |
|---|---|---|
| WHO Environmental Noise Guidelines for the European Region | Not specified in 'relative noise units'; guidelines focus on Lden and Lnight (dB) | cannot determine |
| Noise Policy Statement for England | Not specified in 'relative noise units'; aims to avoid significant adverse impacts | cannot determine |
Sample ID: samples_5fc95794_1420_40f6_ae66_13395c75a1e7