Environmental sensor data for 3 Aug–16 Aug 2025 — 1,867 readings.
Location Map
Particulate Matter (PM)
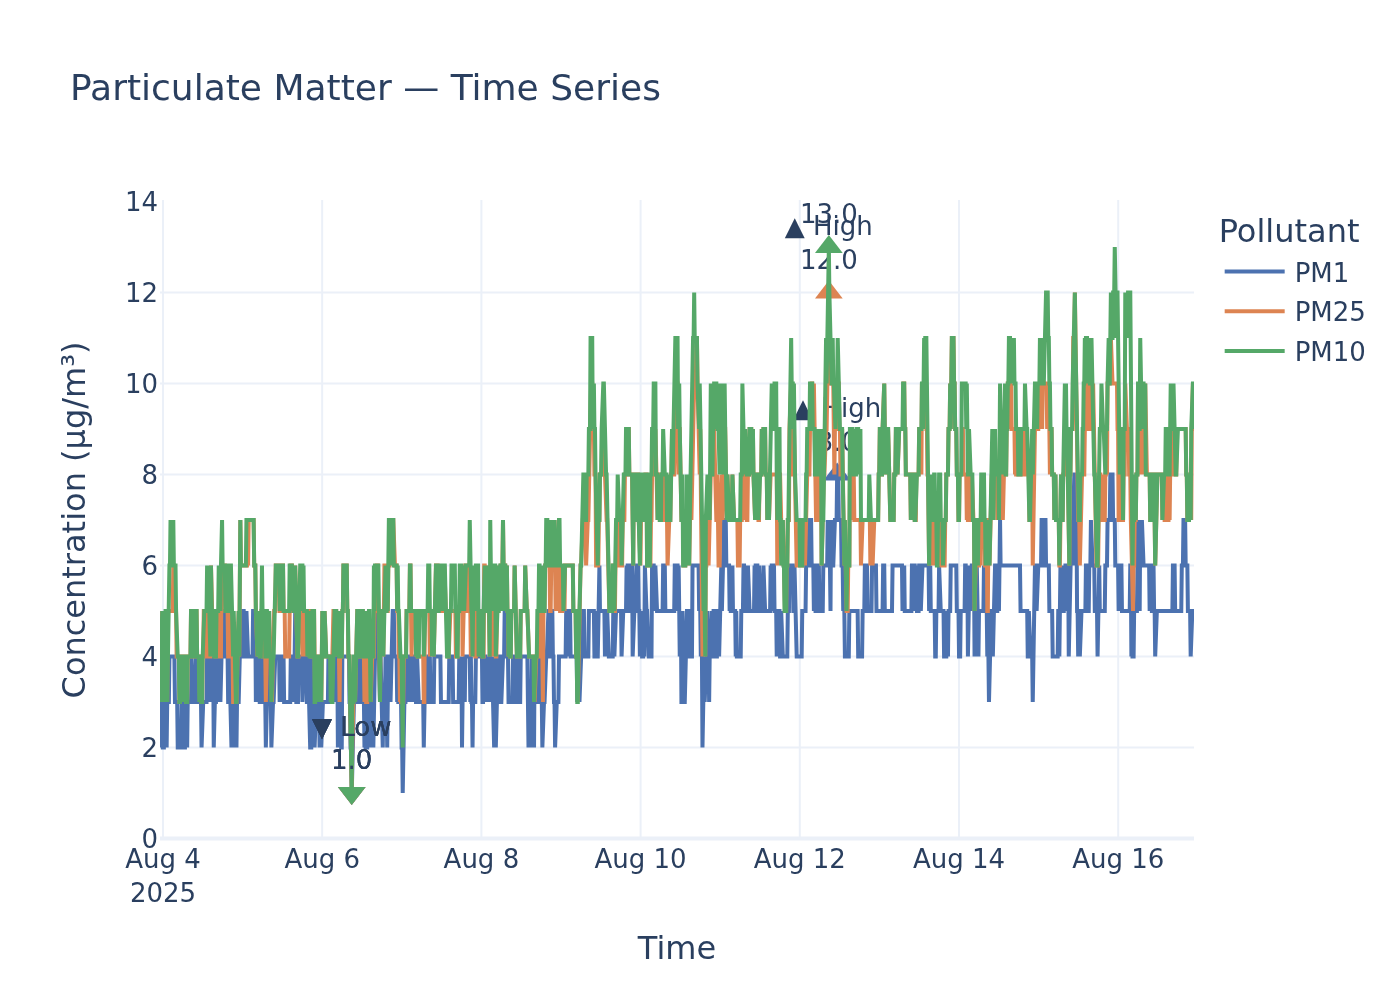
Time-series for PM1, PM2.5, and PM10.
Static image
Particulate Matter Readings Exceed WHO PM2.5 Guideline by 32% During Sampling Session
During a recent environmental sampling session, a sensor recorded particulate matter concentrations, including PM1, PM2.5, and PM10. These measurements provide a snapshot of air quality during the monitoring period.
Findings
Analysis of the recorded data reveals that the mean PM2.5 concentration of 6.6 µg/m³ exceeded the World Health Organization's (WHO) 2021 annual mean guideline of 5 µg/m³. This represents a 32% increase above the internationally recognised health benchmark. In contrast, the UK's Air Quality Standards Regulations 2010 set an annual mean limit for PM2.5 at 20 µg/m³, which the recorded mean value falls significantly below, by 67%. The WHO guideline is therefore considerably stricter for PM2.5.
For PM10, the mean concentration during the sampling session was 7.0 µg/m³. This figure is well within both the UK legal annual mean limit of 40 µg/m³ (82.5% below the limit) and the more stringent WHO 2021 annual mean guideline of 15 µg/m³ (53.33% below the guideline). No specific UK legal limits or WHO guidelines for PM1 were identified in the reviewed policy documents, thus a direct comparison for the mean PM1 reading of 4.5 µg/m³ cannot be made against established benchmarks.
Analysis
The exceedance of the WHO annual mean guideline for PM2.5 is a significant finding, despite the readings falling within current UK legal limits. The WHO explicitly states that there is no safe limit of exposure to PM2.5, and any reduction in its concentration leads to positive health outcomes. Fine particulate matter (PM2.5) is particularly concerning due to its ability to penetrate deep into the lungs and bloodstream, contributing to respiratory diseases, cardiovascular problems, and other adverse health effects.
While UK policy sets a current legal requirement for PM2.5 at an annual mean of 20 µg/m³, and a future target of 10 µg/m³ by the end of 2040 under The Environmental Targets (Fine Particulate Matter) (England) Regulations (2023), the WHO’s 2021 guidelines reflect the latest scientific understanding of health impacts, making their lower thresholds a crucial benchmark for public health. Public bodies, while legally obligated to meet UK standards, are often encouraged to work towards more ambitious targets aligned with WHO recommendations to safeguard public health. The measured PM10 levels, comfortably within both UK and WHO thresholds, offer a more positive outlook for that specific pollutant during the sampling period.
Data Gaps
The user's query did not specify the duration or exact location of the sampling session, nor the averaging period for the 'mean' readings. For a more precise assessment against annual or 24-hour limits, these details would be crucial. Furthermore, the retrieved policy documents do not contain specific UK legal limits or WHO guidelines for PM1, which limits the ability to provide a comprehensive comparison for this pollutant.
Policy Provisions
| Instrument | Threshold | Status |
|---|---|---|
| Air Quality Standards Regulations 2010 | 20 µg/m³ annual mean | within limits |
| World Health Organisation (2021) Global Air Quality Guidelines | 5 µg/m³ annual mean | exceeded |
| Air Quality Standards Regulations 2010 | 40 µg/m³ annual mean | within limits |
| World Health Organisation (2021) Global Air Quality Guidelines | 15 µg/m³ annual mean | within limits |
Ammonia (NH₃)
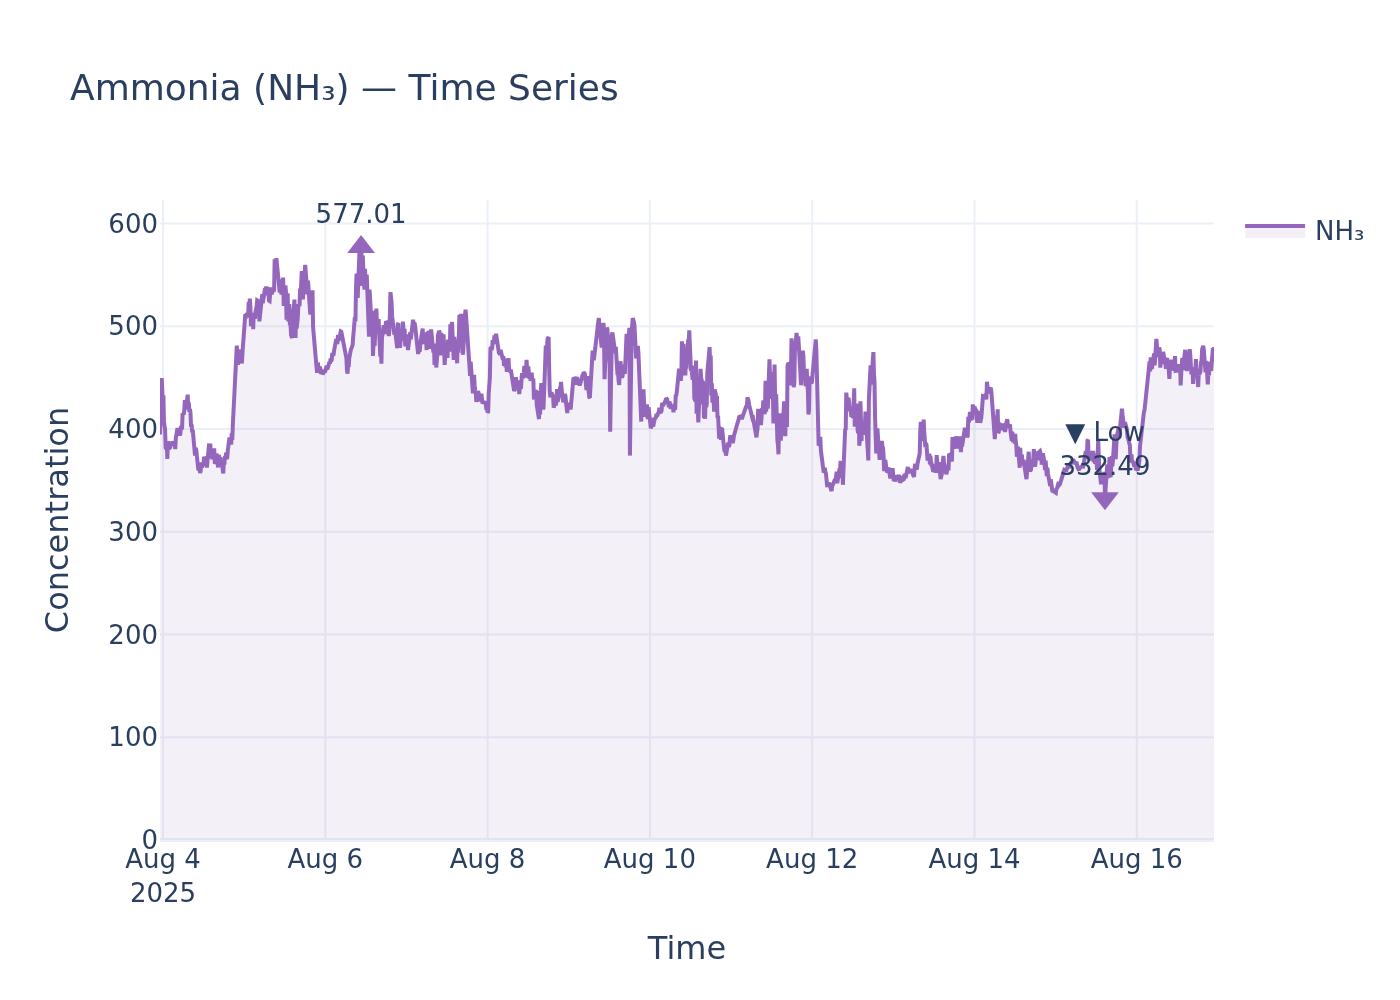
NH₃ concentration time-series.
Static image
Ammonia Readings Highlight Ecological Risk as UK Lacks Local Ambient Air Quality Limits
An environmental sensor recorded ammonia (NH₃) concentrations with a high of 577.01, a low of 332.49, and a mean of 432.60. While these readings indicate the presence of ammonia, current UK environmental policy does not establish statutory local ambient air quality limits for this pollutant, making a direct comparison to legal thresholds challenging.
Findings
The recorded ammonia concentrations, with a mean of 432.60, a low of 332.49, and a high of 577.01, cannot be directly compared against UK statutory ambient air quality limits for local authorities. The retrieved policy documents, specifically the LAQM Policy Guidance 2022, state there is "no statutory LAQM duty on local authorities to consider ammonia." Consequently, there are no specific concentration thresholds to determine whether these readings constitute a breach of local air quality regulations.
At a national level, the UK has established emission reduction commitments for ammonia. The National Emission Ceilings Regulations (NECR) 2018 set targets for a reduction in national ammonia emissions by 8% by 2020 and 16% by 2030, relative to 2005 levels. These are national emission targets, not ambient concentration limits for specific sites.
Analysis
While the specific ammonia readings cannot be assessed against local statutory limits, the detected levels warrant attention due to documented environmental and indirect health implications. Policy documents highlight that ammonia is directly toxic to plants, with even low concentrations impacting species such as moss and lichen. Elevated ammonia deposition can lead to increased nitrogen in soil or water, causing significant long-term harm to sensitive habitats and altering plant community structures, potentially impacting associated animal species.
Furthermore, ammonia plays a role in the formation of secondary particulate matter (PM), a pollutant known to have significant adverse impacts on human health. Although direct health effects of gaseous ammonia at these specific concentrations are not detailed in the provided policy, its contribution to PM formation implies an indirect health concern. The vast majority of UK ammonia emissions originate from agricultural sources, including livestock manure, urine, and fertilisers. Although local authorities do not have a statutory duty to manage ambient ammonia, national policy, such as the Clean Air Strategy, includes targets to reduce reactive nitrogen deposition to protected sensitive sites. The Department for Environment, Food and Rural Affairs (Defra) has also issued a Code of Good Agricultural Practice for Reducing Ammonia Emissions to guide the farming industry.
Data Gaps
A significant data gap exists in the absence of specific UK statutory ambient air quality concentration limits or WHO guidelines for ammonia. Without these thresholds, it is impossible to definitively state whether the reported readings constitute a direct breach of public health or environmental protection standards at the local level. Information on direct human health impacts of gaseous ammonia exposure at specific concentrations would also sharpen this assessment.
Policy Provisions
| Instrument | Threshold | Status |
|---|---|---|
| LAQM Policy Guidance 2022 | No statutory LAQM duty for local authorities regarding ammonia | cannot determine |
| National Emission Ceilings Regulations (NECR) 2018 | 8% emission reduction by 2020, 16% by 2030 (from 2005 levels) | cannot determine |
Noise
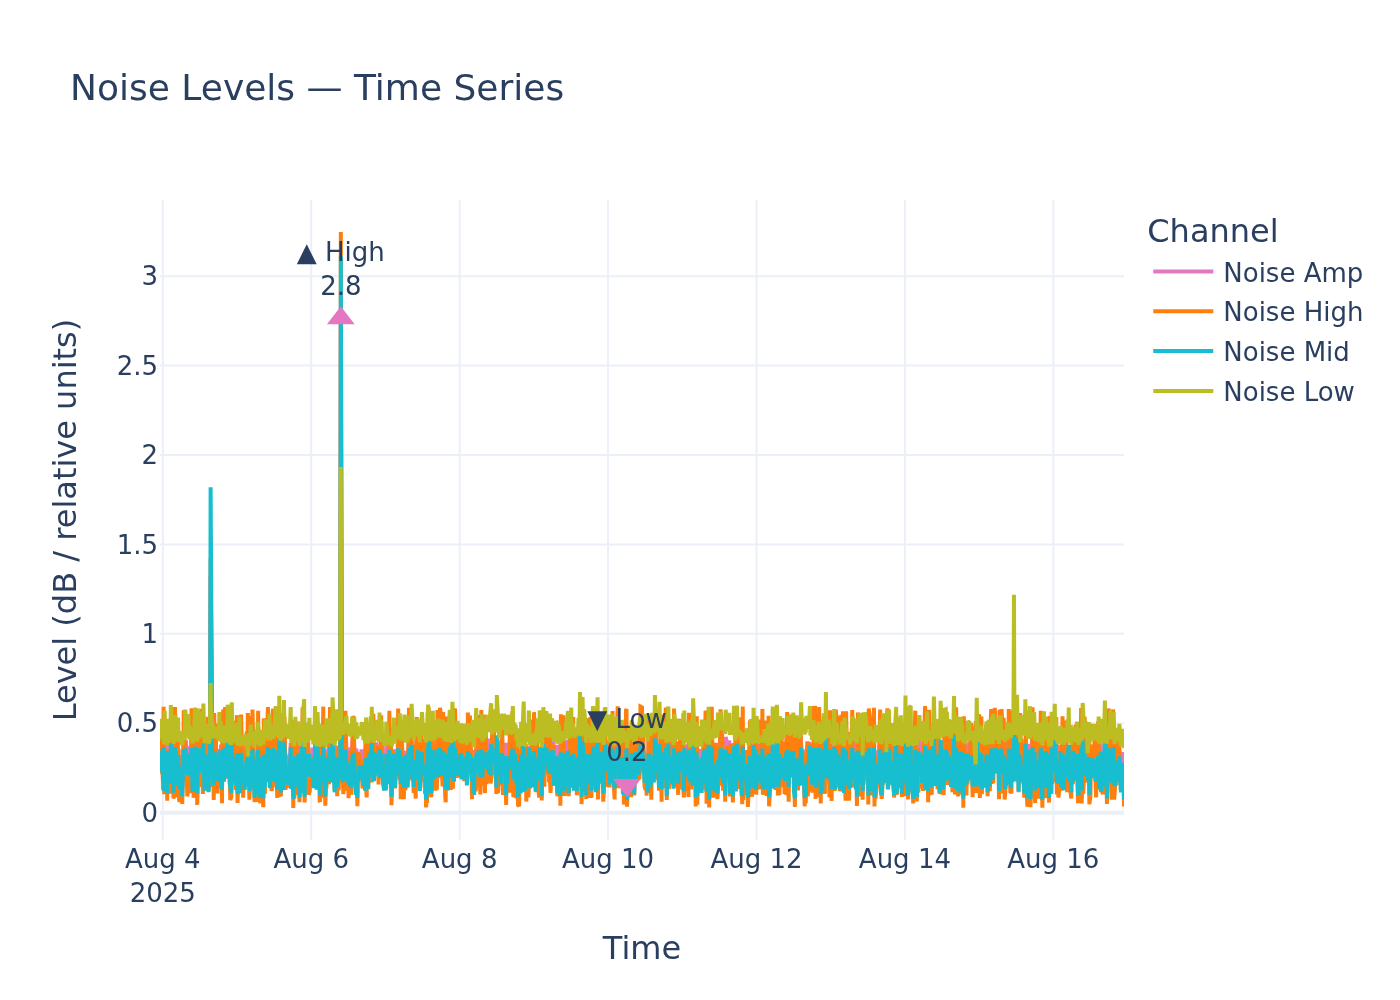
Noise level time-series.
Static image
Uninterpretable Noise Readings Hinder Policy Comparison
An environmental noise sensor recorded levels with a high of 2.8, a low of 0.2, and a mean of 0.3, reported in 'relative noise units'.
Findings
The provided noise levels, expressed in 'relative noise units', cannot be directly compared against established UK noise policy guidance or WHO environmental noise guidelines. The World Health Organization (WHO) guidelines, intended for policy-making in the European Region, primarily utilise specific noise indicators such as Lden and Lnight for exposure assessment. These indicators are typically reported by authorities and are expressed in decibels (dB), reflecting a different measurement standard than the 'relative noise units' supplied. Without a clear conversion or definition of these relative units, it is impossible to determine if the recorded levels exceed or fall within any established thresholds or recommendations.
Analysis
The inability to interpret 'relative noise units' in the context of standard acoustic indicators like Lden and Lnight represents a significant barrier to assessing environmental noise impacts. WHO guidelines, as detailed in documents like 'WHO environmental noise guidelines for the European Region,' are public health-oriented recommendations based on scientific evidence regarding health effects and achievable noise levels. They equip policymakers with an evidence base for guiding exposure reduction and designing effective measures. However, to apply these recommendations, users in countries not employing the specified indicators (Lden and Lnight) are explicitly advised to convert their noise indicators before application, as noted in source [4]. Without such conversion or clarification of the 'relative noise units,' no determination can be made regarding health risks, legal duties, or public body obligations related to these specific readings. The implications for the area therefore remain undetermined based on the data provided.
Data Gaps
A significant data gap exists in the definition and convertibility of 'relative noise units'. WHO guidelines and UK policy documents operate using standard acoustic indicators such as Lden and Lnight, typically measured in decibels (dB). Without information on how 'relative noise units' relate to these standard measurements, it is impossible to assess the readings against legal limits or health guidelines. Further, specific UK noise policy guidance beyond the general WHO framework was not retrieved in sufficient detail to establish UK-specific numerical limits. Clarification on the unit of measurement and its equivalence to standard acoustic indicators is crucial for any meaningful environmental noise assessment.
Sample ID: samples_74db9d9c_d9fc_491e_b8ca_7aa31ece69bc