Environmental sensor data for 20 May 2026, 18:21–21:20 — 1,754 readings, covering approximately 0.1 km.
Location Map
Particulate Matter (PM)
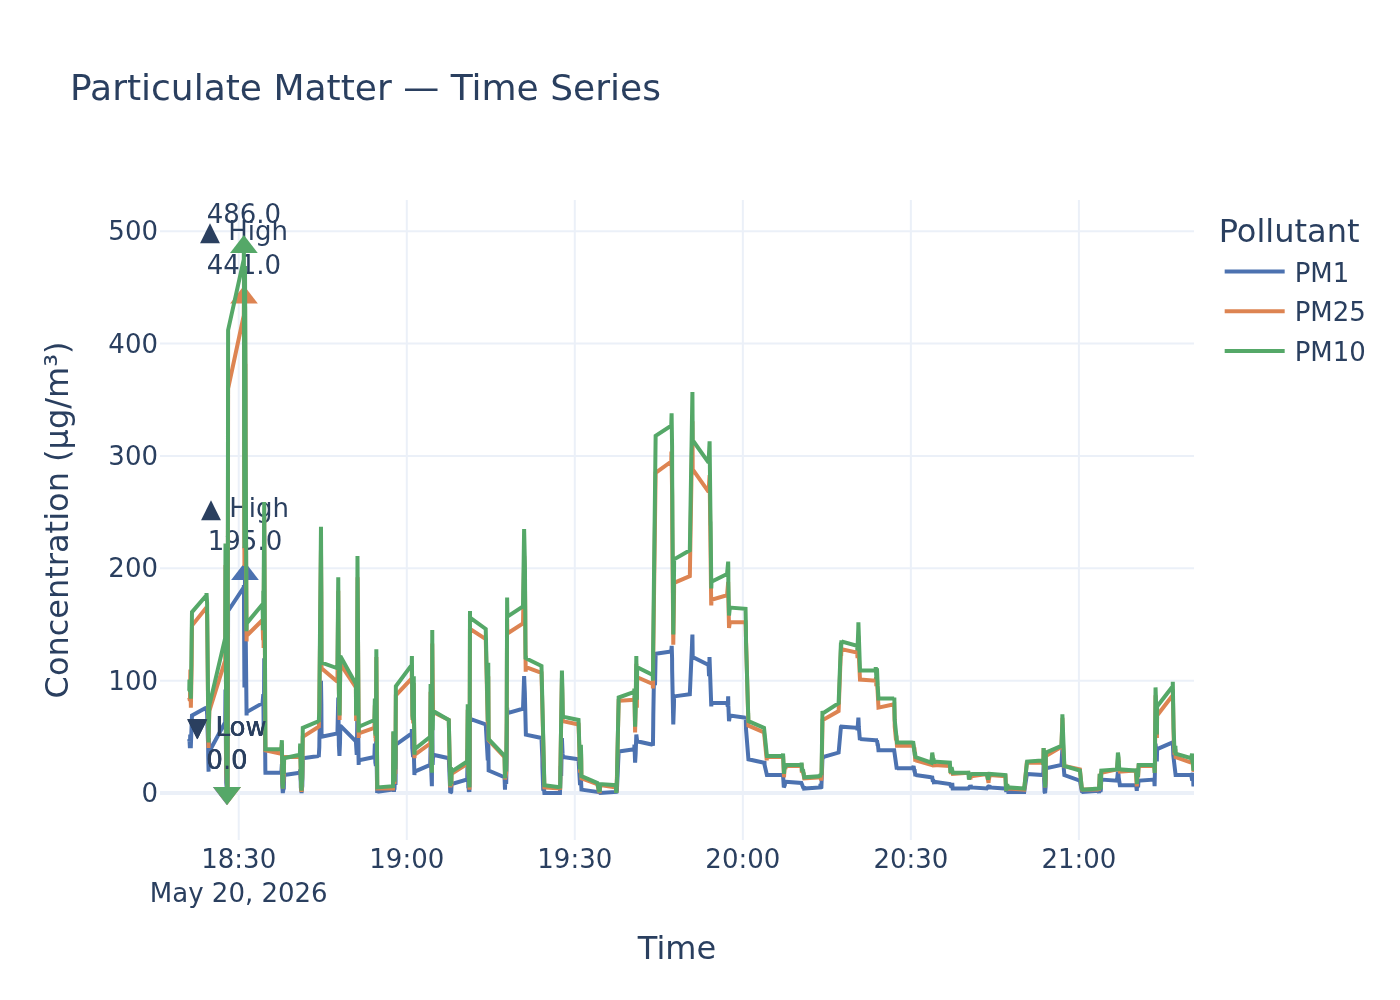
Time-series for PM1, PM2.5, and PM10.
Static image
Particulate Matter Readings Drastically Exceed UK Legal Limits and WHO Guidelines, Signalling Significant Air Quality Crisis
An environmental sensor recorded alarming particulate matter concentrations during a recent sampling session, revealing peak exposures hundreds of percentage points above both national legal thresholds and international health guidelines. The session yielded mean readings of 34.1 µg/m³ for PM1, 72.2 µg/m³ for PM2.5, and 78.3 µg/m³ for PM10, alongside extremely high peak values.
Findings
Analysis of the recorded particulate matter data reveals substantial exceedances across all regulated categories when compared against UK statutory limits and World Health Organization (WHO) guidelines. For PM2.5, the mean concentration of 72.2 µg/m³ is 261% above the UK annual mean limit of 20 µg/m³, as mandated by The Air Quality Standards Regulations 2010 (Source [3], Regulation 7(1)). This mean also stands at a staggering 1344% above the more stringent 2021 WHO annual guideline of 5 µg/m³ (Source [4]). The recorded high of 441.0 µg/m³ for PM2.5 further underscores severe peak pollution, vastly exceeding the WHO's 24-hour guideline of 15 µg/m³ by 2840% (Source [4]).
For PM10, the mean concentration of 78.3 µg/m³ is 95.75% higher than the UK annual mean limit of 40 µg/m³, also stipulated by The Air Quality Standards Regulations 2010 (Source [3], Regulation 7(1)). This figure is 422% above the 2021 WHO annual guideline of 15 µg/m³ (Source [4]). The highest PM10 reading, at 486.0 µg/m³, represents an 872% exceedance of the UK’s 24-hour mean limit of 50 µg/m³ (Source [3], Regulation 7(1)), which permits no more than 35 exceedances per calendar year. It also exceeds the 2021 WHO 24-hour guideline of 45 µg/m³ by 980% (Source [4]).
While PM1 readings were provided, specific UK legal limits or WHO guidelines for PM1 were not found within the consulted policy documents. The WHO emphasizes there is no safe limit of exposure to PM2.5, indicating that any reduction in concentration leads to positive health outcomes (Source [2]).
Analysis
The exceptionally high particulate matter concentrations recorded in this sampling session present a grave concern for public health and indicate a serious breach of air quality standards. Both PM2.5 and PM10, particularly at the reported mean and peak levels, are linked to significant respiratory and cardiovascular health risks. The World Health Organization explicitly states there is no safe level of exposure to PM2.5, underscoring the severity of these readings. While the UK legal limits, transposed from EU law, aim to protect public health, they are considerably less stringent than the 2021 WHO guidelines. The substantial exceedances against the WHO guidelines highlight the inadequacy of current legal limits in safeguarding against the full spectrum of health impacts. Local authorities bear the legal duty to monitor air quality and work towards achieving these standards. The recorded high values suggest acute pollution events that would require urgent investigation and potential intervention to reduce emissions from sources such as domestic wood burning and vehicle tyre and brake wear, as identified in UK policy documents (Source [3]). Without targeted action, the local population faces heightened exposure to harmful airborne particulates.
Data Gaps
To sharpen this assessment, the precise averaging period of the 'sampling session' mean values is crucial, as air quality limits are defined over specific durations (e.g., 24-hour, annual). Additionally, the frequency or duration of the high particulate matter events would be necessary to determine if the 24-hour exceedance limits, particularly for PM10 (allowing 35 exceedances per year), have been triggered. Furthermore, while PM1 readings were provided, specific UK or WHO policy limits for this particulate size were not found in the retrieved documents, limiting a complete policy-based comparison for PM1.
Policy Provisions
| Instrument | Threshold | Status |
|---|---|---|
| The Air Quality Standards Regulations 2010 | 20 µg/m³ annual mean | exceeded |
| 2021 WHO Global Air Quality Guidelines | 5 µg/m³ annual mean | exceeded |
| 2021 WHO Global Air Quality Guidelines | 15 µg/m³ 24-hour mean | exceeded |
| The Air Quality Standards Regulations 2010 | 40 µg/m³ annual mean | exceeded |
| The Air Quality Standards Regulations 2010 | 50 µg/m³ 24-hour mean (not to be exceeded more than 35 times a year) | exceeded |
| 2021 WHO Global Air Quality Guidelines | 15 µg/m³ annual mean | exceeded |
| 2021 WHO Global Air Quality Guidelines | 45 µg/m³ 24-hour mean | exceeded |
| N/A | N/A for PM1 | cannot determine |
Ammonia (NH₃)
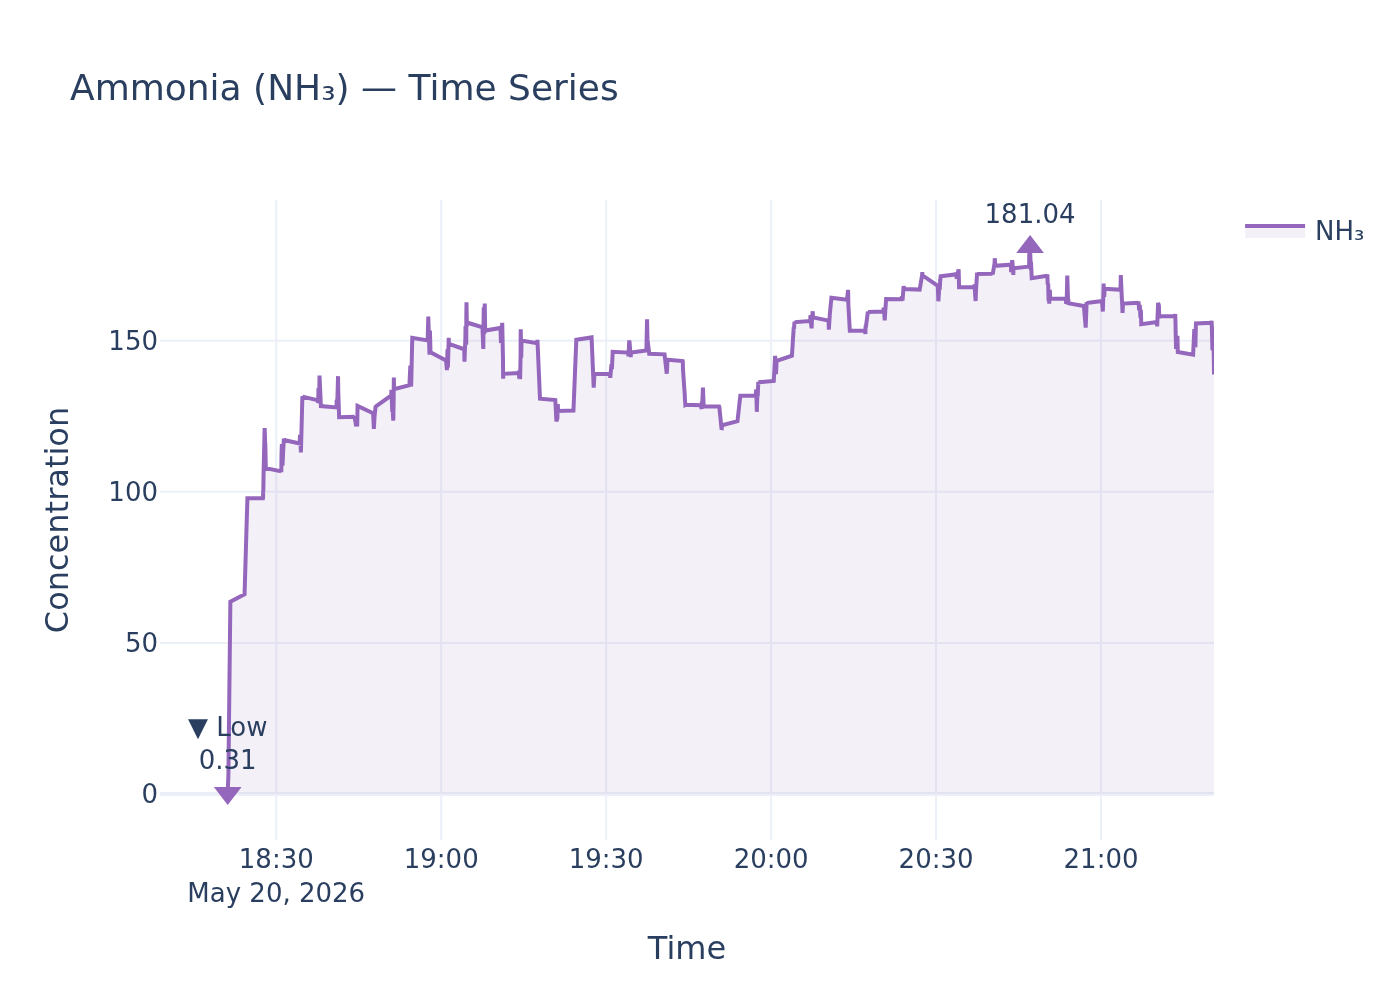
NH₃ concentration time-series.
Static image
Ammonia Readings Highlight Ecological Risk as UK Lacks Ambient Air Quality Limits
An environmental sensor recorded ammonia (NH₃) levels with a mean concentration of 144.79, a high of 181.04, and a low of 0.31. While these figures represent the detected presence of ammonia, the UK's policy framework currently does not establish statutory ambient air quality limits for this pollutant, focusing instead on emission reduction targets and ecological impacts.
Findings
The sensor's reported ammonia concentrations, including a high of 181.04 and a mean of 144.79, cannot be directly assessed against UK legal limits or World Health Organization (WHO) guidelines for ambient air quality concentrations, as these are not defined within the retrieved policy documents. The "LAQM Policy Guidance 2022" explicitly states that there is "no statutory LAQM duty on local authorities to consider ammonia" (LAQM Policy Guidance 2022, paragraph 10.23). Therefore, a determination of whether these specific readings constitute an exceedance of a legal or guideline threshold is not possible based on current UK air quality regulations. Policy instead focuses on national statutory targets for reducing ammonia emissions, aiming for an 8% reduction by 2020 and a 16% reduction by 2030 from 2005 levels (LAQM Policy Guidance 2022, paragraph 10.23).
Analysis
While direct ambient air quality limits for ammonia are absent from UK policy, the environmental implications of the gas are clearly documented. Ammonia is a known ecotoxin, capable of causing "major changes to plant community structure" and affecting associated animal species, even at "very low concentrations" (air_pollution_uk_2024_issue_1.pdf, page 41). Furthermore, ammonia plays a critical role in the formation of secondary particulate matter, which can travel long distances and contribute to broader air quality issues (air_pollution_uk_2024_issue_1.pdf, page 41). The primary source of ammonia emissions in the UK, accounting for approximately 88%, is agriculture, predominantly from livestock manure, urine, and inorganic fertilisers (LAQM Policy Guidance 2022, paragraph 10.24). Given the absence of specific ambient concentration limits, the reported sensor readings, particularly the high and mean values, suggest a potential for ecological impact in the vicinity of the monitoring site, despite not triggering a breach of an air quality standard. Local authorities currently do not have a statutory duty under LAQM to manage ammonia concentrations, although national targets exist for reducing overall emissions.
Data Gaps
A key data gap is the absence of specific UK legal limits or WHO guidelines for ambient ammonia concentrations to which the sensor readings can be directly compared. Information on the exact location of the sensor and the duration of the monitoring period would also provide a more precise context for assessing potential localised impacts and trends. Further detail on the methodology of the ammonia measurement (e.g., averaging time) would also be beneficial for comparison if relevant guidelines existed.
Policy Provisions
| Instrument | Threshold | Status |
|---|---|---|
| LAQM Policy Guidance 2022 | No statutory ambient air quality limit for NH₃ | cannot determine |
Noise
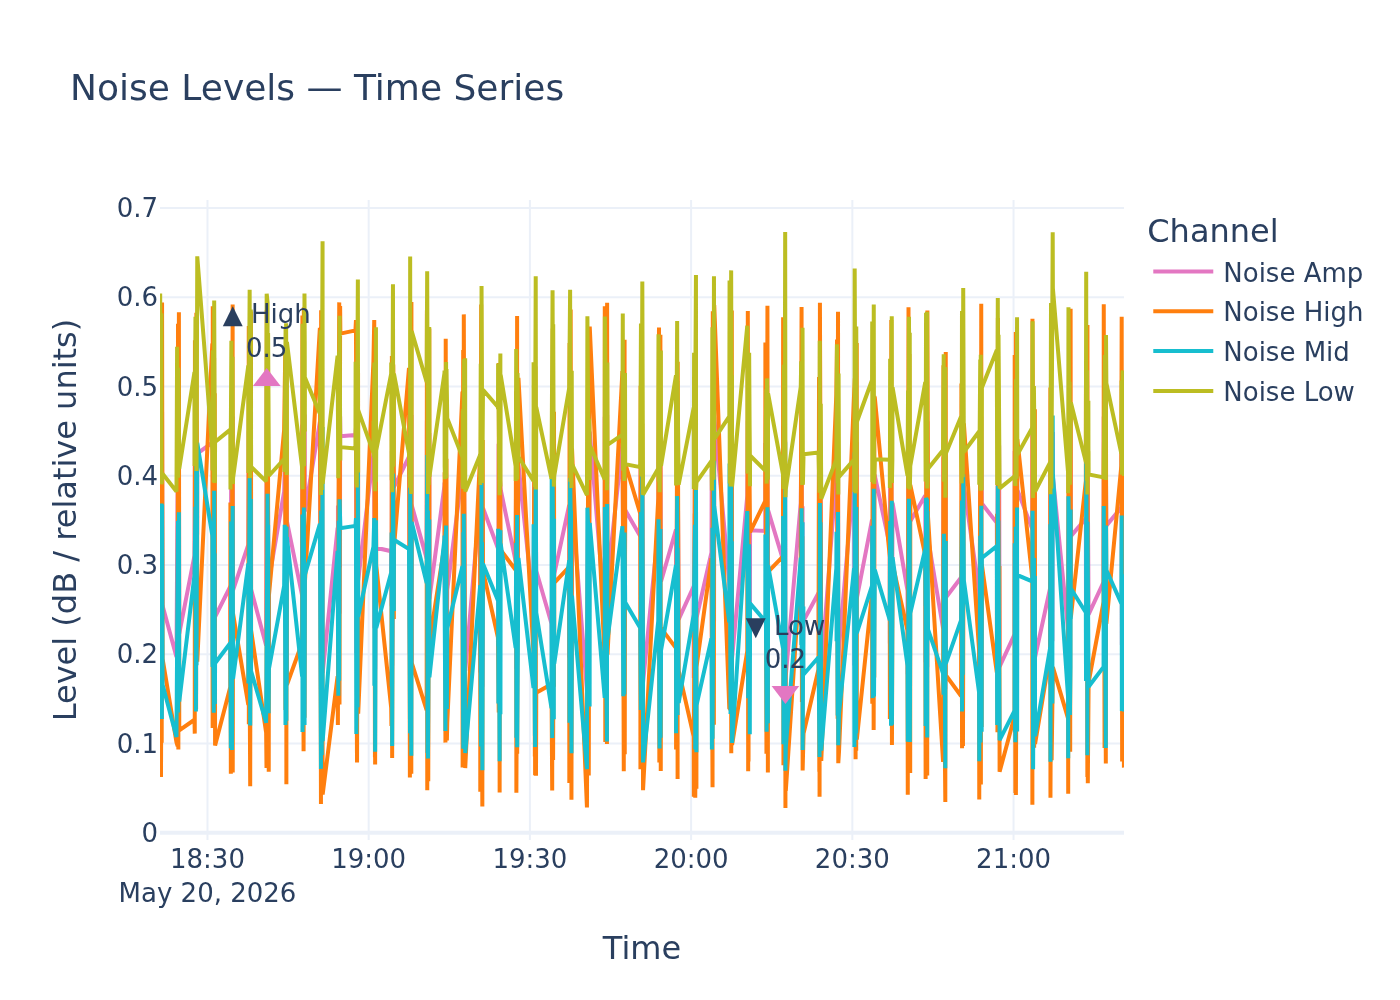
Noise level time-series.
Static image
Absence of National Noise Limits Hinders Assessment of Relative Noise Levels Against UK and WHO Guidelines
An environmental noise sensor recorded a high of 0.5, a low of 0.2, and a mean of 0.3 relative noise units. This assessment examines these readings against available UK and WHO environmental noise policy.
Findings
The recorded noise levels of 0.5 (high), 0.2 (low), and 0.3 (mean) relative noise units cannot be directly compared against explicit numerical limits within the current UK national noise policy or general WHO environmental noise guidelines. Unlike air quality, the UK currently lacks national noise limits that must be met, as stated in policy documents.
Analysis
While the specific relative noise units cannot be directly evaluated against numerical thresholds from the provided policy documents, both UK and WHO guidance emphasize the importance of managing environmental noise. The UK's Noise Policy Statement for England (NPSE) aims to 'Promote good health and a good quality of life through the effective management of noise' and to 'avoid significant adverse impacts on health and quality of life.' This policy, however, does not set national noise limits, noting that specific local limits may exist for particular developments. The World Health Organization (WHO) has developed environmental noise guidelines for the European Region, providing public health recommendations on exposure from sources such as transportation and leisure noise. These guidelines aim to protect human health; however, the provided policy excerpts do not specify the numerical indicators or thresholds that would allow for a direct comparison with the sensor's readings in 'relative noise units.' The implication for this area is that while noise management is a policy objective, the absence of directly comparable national or general WHO numerical limits for these 'relative noise units' means that the recorded levels cannot be definitively classified as exceeding or falling within established health-protective thresholds based solely on the provided policy context.
Data Gaps
To sharpen this assessment, specific numerical limits or guideline values for environmental noise, expressed in 'relative noise units' or a comparable metric, are absent from the retrieved UK and WHO policy documents. Further information on the methodology and units of 'relative noise units,' along with any local noise limits applicable to the specific area, would be necessary for a definitive comparison.
Policy Provisions
| Instrument | Threshold | Status |
|---|---|---|
| Noise Policy Statement for England | No national numerical limits specified for general environmental noise | cannot determine |
| WHO Environmental Noise Guidelines for the European Region | No general numerical limits specified in provided context for 'relative noise units' | cannot determine |
Sample ID: samples_7bf5f4d3_2fd8_496f_8530_7bfb82c5eed2