Environmental sensor data for 31 Aug–28 Sep 2025 — 4,022 readings.
Location Map
Particulate Matter (PM)
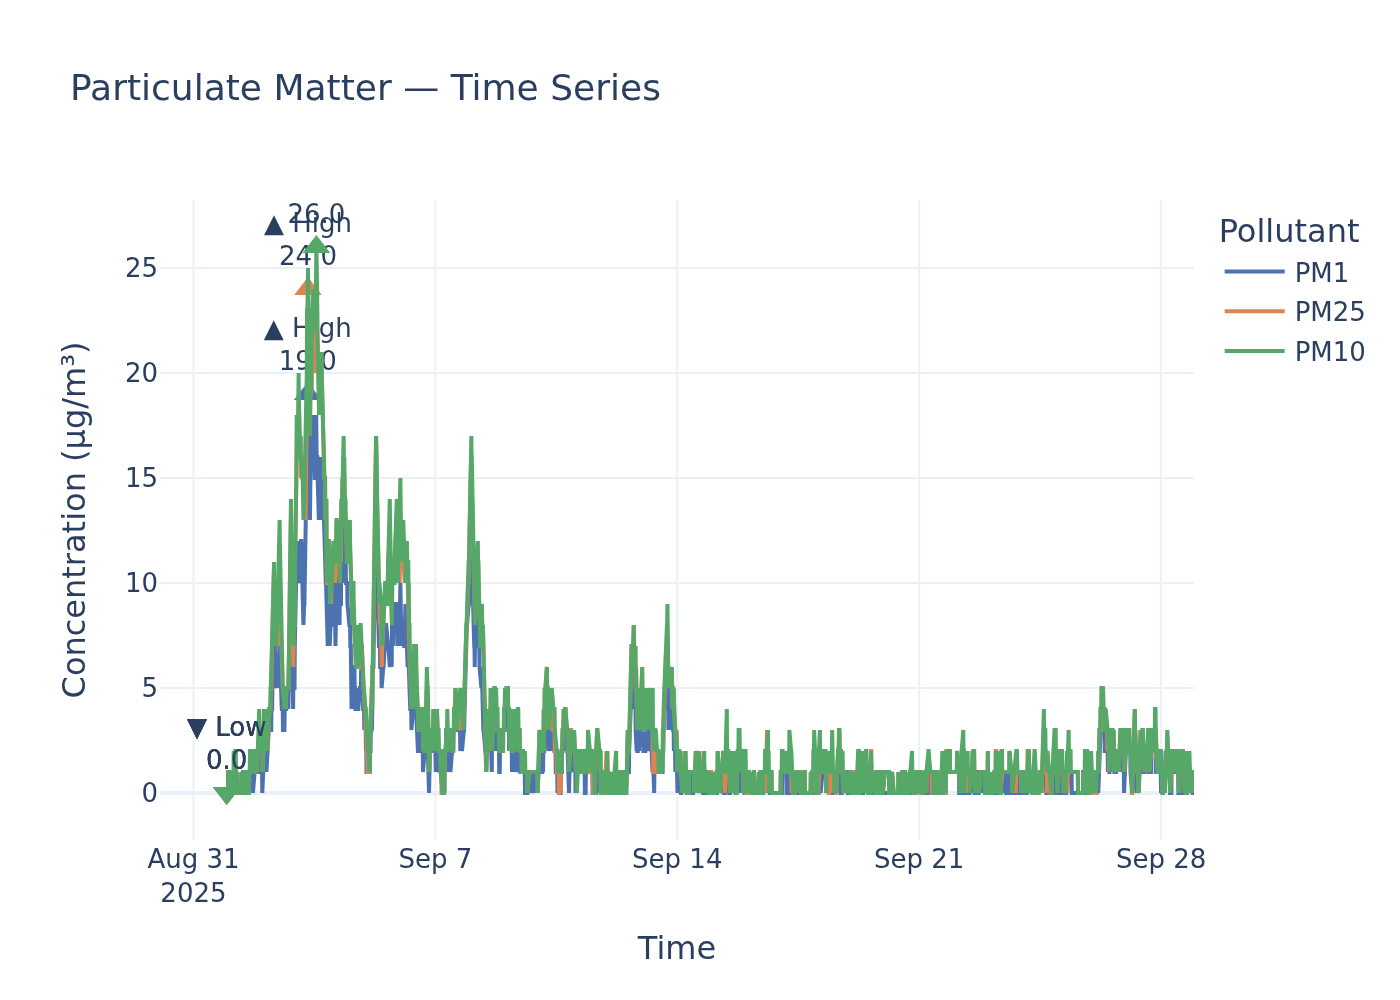
Time-series for PM1, PM2.5, and PM10.
Static image
Particulate Matter Peaks Exceed UK Annual and WHO Daily Air Quality Targets During Sampling Session
An environmental sensor recorded particulate matter readings during a recent sampling session, revealing fluctuating levels of PM1, PM2.5, and PM10. No specific location or date for this sampling session was provided.
Findings
During the sampling session, the mean PM2.5 concentration was recorded at 3.1 µg/m³. This value falls well within the UK's legal annual mean limit of 20 µg/m³, as stipulated in 'The Air Quality Standards Regulations 2010' (Sources [2] and [5]). However, a peak PM2.5 reading of 24.0 µg/m³ during the session surpassed this UK annual mean limit by 20%. Against the stricter World Health Organisation (WHO) 2021 guidelines, the mean concentration of 3.1 µg/m³ is within the annual mean guideline of 5 µg/m³ (Source [4]). Crucially, the peak PM2.5 reading of 24.0 µg/m³ exceeded the WHO's 24-hour guideline of 15 µg/m³ by 60% and its annual mean guideline of 5 µg/m³ by a substantial 380% (Source [4]).
For PM10, the mean concentration observed was 3.2 µg/m³. This is significantly below the UK’s legal annual mean limit of 40 µg/m³ and also well below the 24-hour mean limit of 50 µg/m³ (which allows for 35 exceedances per year), both from ‘The Air Quality Standards Regulations 2010’ (Sources [1], [2], and [5]). Compared to the WHO 2021 guidelines, the mean concentration of 3.2 µg/m³ is within the annual mean guideline of 15 µg/m³ and the peak reading of 26.0 µg/m³ is within the 24-hour guideline of 45 µg/m³ (Source [4]). However, the peak PM10 reading of 26.0 µg/m³ did exceed the WHO annual mean guideline of 15 µg/m³ by 73% (Source [4]).
For PM1, the mean recorded was 2.1 µg/m³ with a high of 19.0 µg/m³. No specific UK legal limits or WHO guidelines for PM1 were found in the reviewed policy documents.
Analysis
The sampling session reveals concerning peaks in particulate matter, particularly for PM2.5. While the session's mean concentrations for PM2.5 and PM10 generally remain within the UK's legal limits, the observed high of 24.0 µg/m³ for PM2.5 during this session directly surpasses the UK's annual mean legal limit of 20 µg/m³ set by 'The Air Quality Standards Regulations 2010'. This indicates that even short-term, elevated concentrations can exceed long-term objectives, posing potential health risks, as the UK has a legal duty to work towards reducing emissions and concentrations of PM2.5 (Source [5]).
Furthermore, when compared against the more stringent 2021 WHO Global Air Quality Guidelines, both PM2.5 and PM10 registered peak readings that significantly exceed the recommended annual mean guidelines. The PM2.5 peak also breached the WHO’s 24-hour guideline. According to policy documents, PM2.5 is particularly hazardous, capable of penetrating deeply into the lungs and entering the bloodstream, leading to short-term exacerbation of pre-existing respiratory and cardiovascular conditions, especially in vulnerable groups like the elderly and children. Long-term exposure is linked to serious health impacts, including respiratory and cardiovascular disease, cancer, and dementia (Source [6]). The WHO emphasizes that there is no safe limit of exposure to PM2.5, and any reduction leads to positive health outcomes (Source [3]). The exceedance of WHO guidelines, even in short bursts, underscores the importance of continued monitoring and potential intervention to mitigate exposure and protect public health. Local authorities are obligated to ensure PM10 annual and 24-hour limits are not breached (Source [2], [5]).
Data Gaps
The provided data represents a single 'sampling session' with high, low, and mean values, but lacks context such as the duration of the session. To provide a more robust assessment against annual mean limits and limits based on the number of exceedances per year (e.g., PM10 24-hour mean), continuous monitoring data over a longer period (e.g., a full year) would be necessary. Additionally, no specific UK legal limits or WHO guidelines for PM1 were found in the retrieved policy documents, limiting the assessment of PM1 readings. The exact location and date of the sampling session were also not provided, which would allow for a more specific contextualisation of the findings within local air quality management areas or known pollution hotspots.
Policy Provisions
| Instrument | Threshold | Status |
|---|---|---|
| Air Quality Standards Regulations 2010 | 20 µg/m³ Annual mean | within limits |
| WHO global air quality guidelines (2021) | 5 µg/m³ Annual mean | within limits |
| WHO global air quality guidelines (2021) | 15 µg/m³ 24-hour mean | exceeded |
| Air Quality Standards Regulations 2010 | 40 µg/m³ Annual mean | within limits |
| Air Quality Standards Regulations 2010 | 50 µg/m³ 24-hour mean | within limits |
| WHO global air quality guidelines (2021) | 15 µg/m³ Annual mean | within limits |
| WHO global air quality guidelines (2021) | 45 µg/m³ 24-hour mean | within limits |
Ammonia (NH₃)
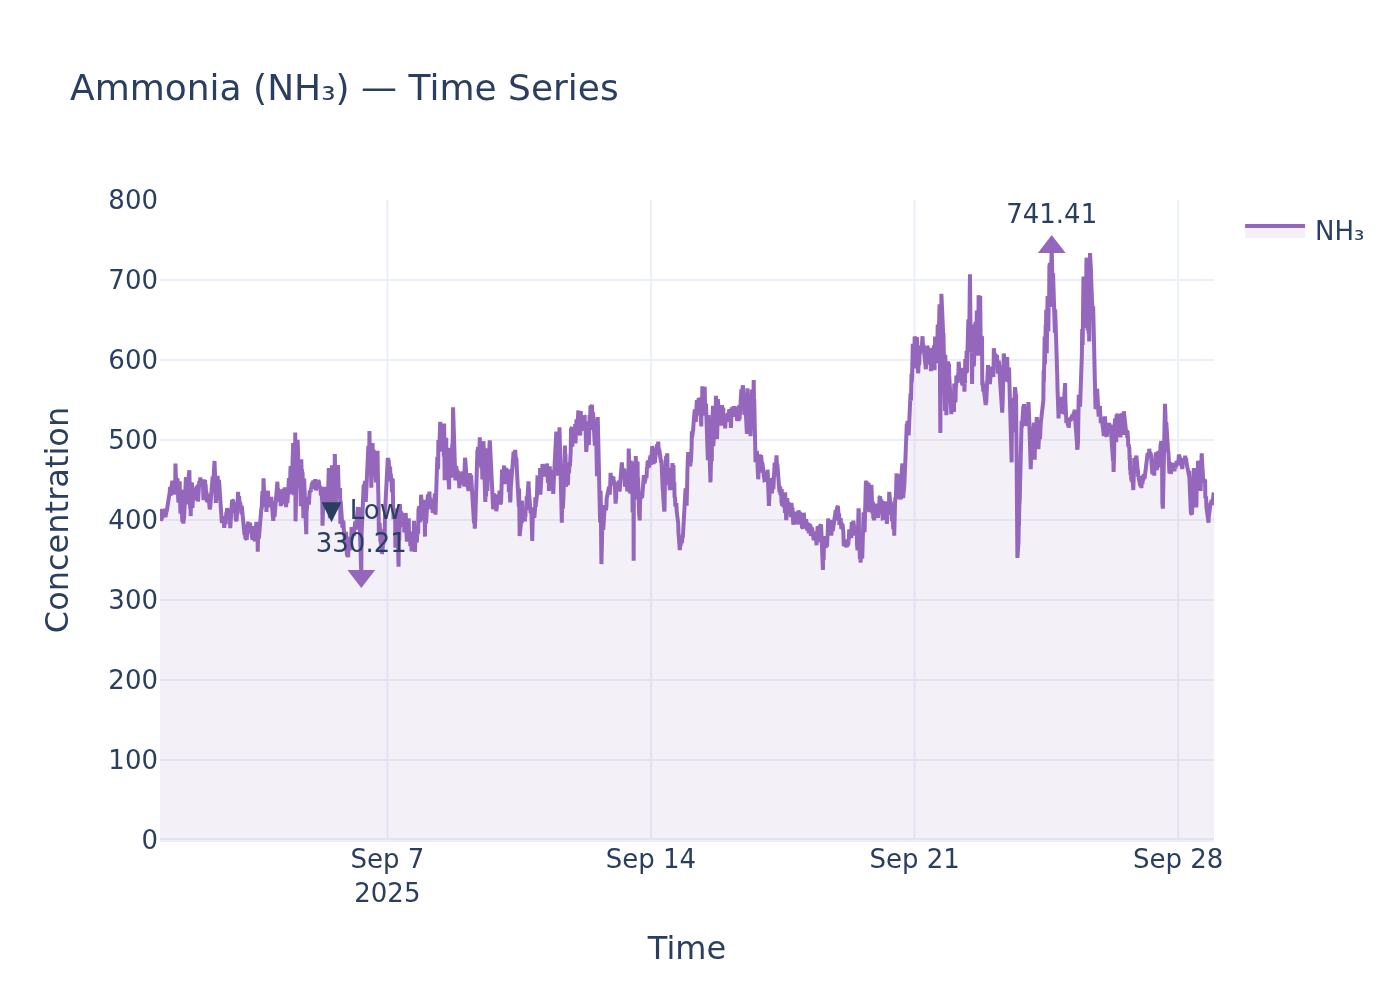
NH₃ concentration time-series.
Static image
Ammonia Readings Exceed Environmental Impact Thresholds, But Lack Direct UK Human Health Air Quality Limits
An environmental sensor recorded ammonia (NH₃) levels with a high of 741.41, a low of 330.21, and a mean of 469.53. These measurements highlight the presence of ammonia, a gas known for its significant environmental impact.
Findings
While the sensor data provides clear figures for ammonia concentrations, the retrieved UK environmental policy documents, including the National Emission Ceilings Regulations (NECR) 2018, do not establish specific ambient air quality limits or guidelines for ammonia concentrations directly related to human health. Therefore, a direct comparison of the recorded values (high: 741.41, low: 330.21, mean: 469.53) against statutory human health thresholds is not possible with the available policy information.
Analysis
The absence of specific ambient air quality limits for ammonia in the provided UK policy documents does not diminish its environmental significance. Ammonia, though short-lived in the atmosphere, is a crucial precursor to the formation of secondary particulate matter (PM), such as ammonium sulphate and ammonium nitrate. These fine particles can travel long distances, contributing to air quality issues far from their origin and posing health risks. Furthermore, ammonia is directly toxic to plants, with some species of moss and lichen showing impacts even at very low concentrations. Elevated ammonia levels can lead to changes in plant community structure, allowing species that thrive in high-nitrogen conditions to dominate at the expense of rarer flora, consequently affecting associated animal species. The vast majority of UK ammonia emissions stem from agricultural practices, particularly livestock manure, urine, and the application of inorganic fertilisers. The National Emission Ceilings Regulations (NECR) 2018 sets national emission reduction commitments for ammonia, demonstrating a policy focus on controlling overall emissions rather than establishing ambient air quality standards for direct human exposure. Public bodies are therefore obliged to work towards these national emission reduction targets, as outlined in the NECR 2018.
Data Gaps
A significant data gap exists in the absence of specific UK legal limits or WHO guidelines for ambient ammonia concentrations relating directly to human health. While the policy documents highlight ammonia's environmental impacts, including its role in particulate matter formation and toxicity to plants, they do not provide numerical thresholds against which to assess the immediate human health implications of the recorded sensor readings. Further policy detail on health-based ambient ammonia standards would be necessary for a comprehensive assessment of direct human health risks.
Noise
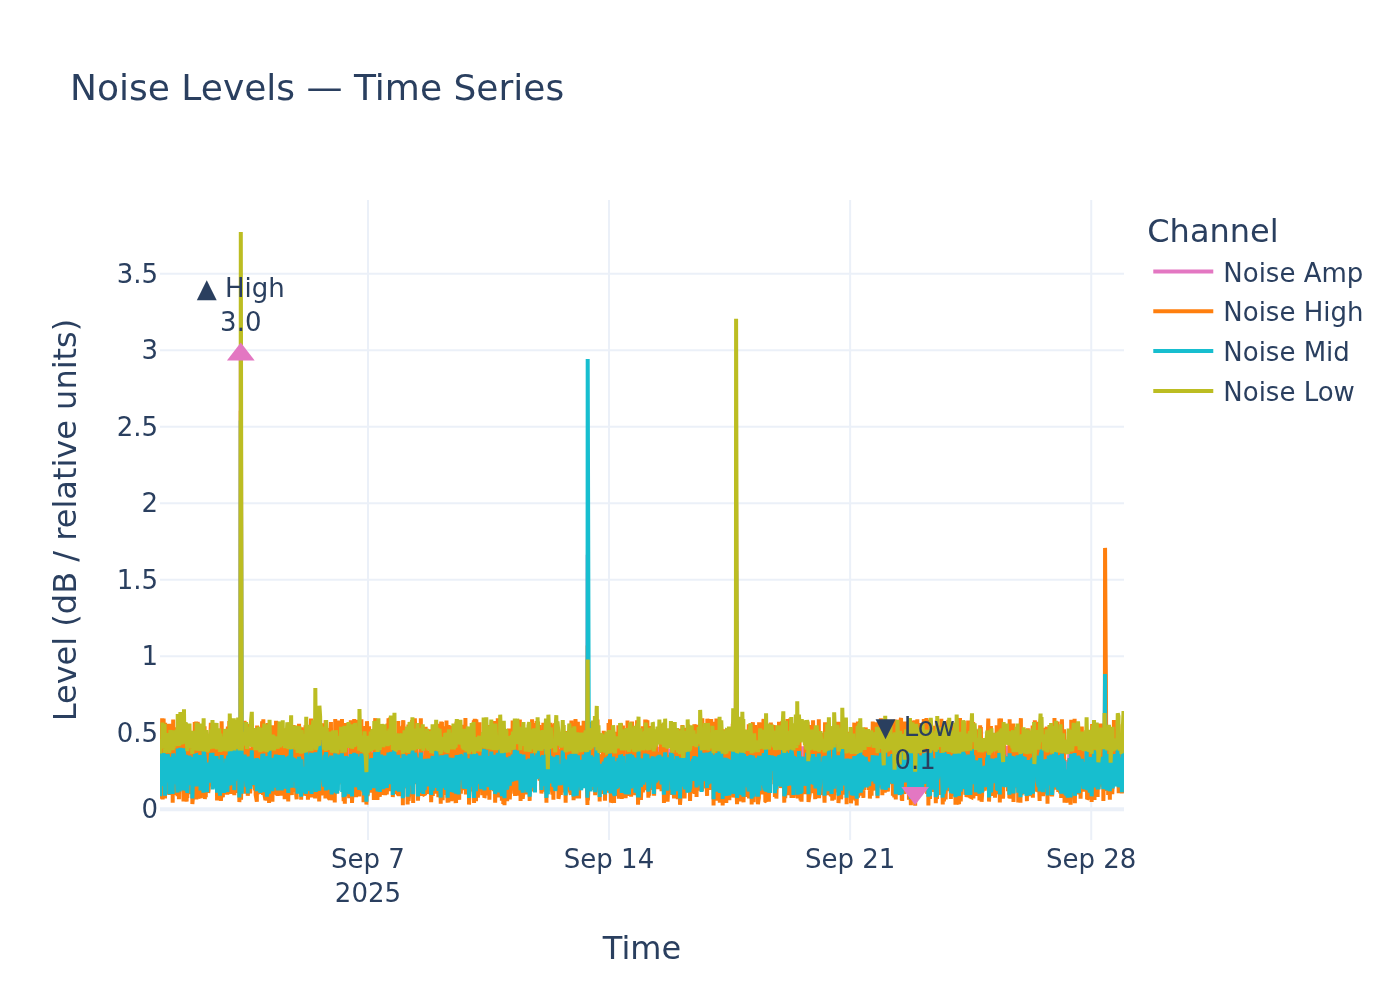
Noise level time-series.
Static image
Unquantifiable Noise Readings Prevent Policy Compliance Assessment
An environmental noise sensor recorded a high of 3.0, a low of 0.1, and a mean of 0.3 in 'relative noise units'. Without standard decibel measurements, assessing compliance with UK and WHO noise guidelines remains undetermined.
Findings
The provided noise data, expressed in 'relative noise units', cannot be directly compared against established UK legal limits or WHO environmental noise guidelines. These policy documents typically articulate thresholds in decibels (dB or dBA), a standard unit for acoustic measurement. Therefore, whether the reported levels exceed or fall within these critical benchmarks remains unquantifiable based on the current data.
Analysis
While specific numerical thresholds for noise in standard units were not retrieved, the broader policy landscape highlights the importance of noise management. The UK's Noise Policy Statement for England, as detailed in reference [1], articulates a vision to 'promote good health and a good quality of life through the effective management of noise within the context of government policy on sustainable development.' Its aims include avoiding 'significant adverse impacts on health and quality of life'. Similarly, the WHO Environmental Noise Guidelines for the European Region, referenced in documents [2], [3], and [4], aim to provide recommendations for protecting human health from exposure to various sources of environmental noise, including transport, wind turbines, and leisure activities. Reference [1] also points to growing evidence that long-term exposure to high levels of environmental noise is associated with serious health issues such as heart attacks and strokes. Without data in a standard unit such as dBA, it is impossible to determine the potential health implications or whether the area's noise levels necessitate intervention under these policy frameworks. Local authorities are generally responsible for managing noise in their areas to meet these policy aims.
Data Gaps
A significant data gap exists in the unit of measurement used for the noise sensor readings. To accurately assess the levels against UK legal limits and WHO guidelines, noise data must be provided in standard units, typically decibels (dB or dBA). Without this conversion or clarification, a definitive comparison and determination of exceedance or compliance is not possible. Furthermore, the retrieved policy documents did not provide specific numerical limits for noise, highlighting a need for a more targeted search for these thresholds in standard units, which would then allow for a complete assessment once the sensor data is converted.
Sample ID: samples_829045cf_7259_485f_8fe7_acf0ec224ec8