Environmental sensor data for 22 Feb 2026, 14:24–15:18 — 325 readings, covering approximately 0.9 km.
Location Map
Particulate Matter (PM)
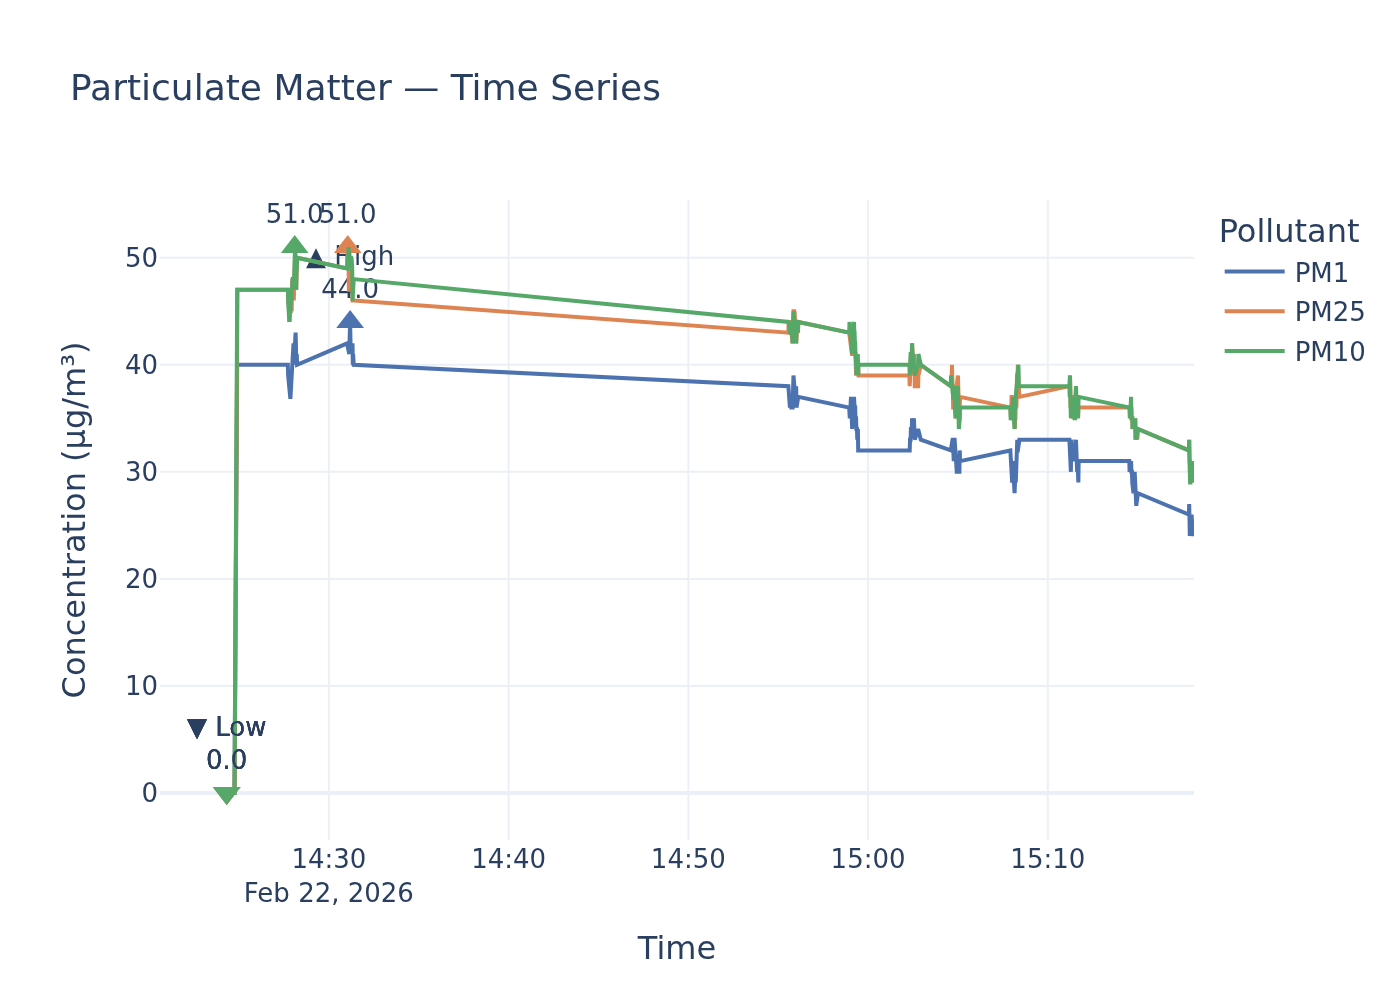
Time-series for PM1, PM2.5, and PM10.
Static image
Particulate Matter Readings Reveal Significant PM2.5 Exceedances Against UK Legal Limits and WHO Guidelines
During a recent sampling session, an environmental sensor recorded mean particulate matter concentrations, revealing concerning levels of PM2.5 and PM10.
Findings
The sensor data shows a mean PM2.5 concentration of 36.2 µg/m³, alongside a mean PM10 concentration of 36.4 µg/m³. These figures indicate a troubling picture when measured against established air quality benchmarks.
For PM2.5, the recorded mean of 36.2 µg/m³ represents a substantial exceedance of the UK’s annual average legal limit. The Air Quality Standards Regulations 2010 mandate an annual average of no more than 20 µg/m³ for PM2.5. The sampled mean is 81% above this national legal ceiling, signalling a potential breach of regulatory obligations if sustained over an annual period.
Furthermore, the World Health Organisation (WHO) sets a significantly stricter annual mean guideline for PM2.5 at just 5 µg/m³. The recorded mean of 36.2 µg/m³ soars an alarming 624% above this international health recommendation. Even when considering a 24-hour average, if the sampling session’s mean is interpreted as such, the reading surpasses the WHO’s 24-hour guideline of 15 µg/m³ by 141%. The WHO explicitly states there is no safe limit of exposure to PM2.5, and any reduction leads to positive health outcomes, underscoring the severity of these elevated levels.
In the case of PM10, the mean concentration of 36.4 µg/m³ falls within current UK legal limits. The Air Quality Standards Regulations 2010 establish an annual average limit of 40 µg/m³ for PM10, placing the recorded mean 9% below this threshold. Similarly, if interpreted as a 24-hour average, the reading is below the UK’s 24-hour limit of 50 µg/m³ (not to be exceeded more than 35 times a year), specifically 27.2% below. However, when compared to the more stringent WHO annual mean guideline of 15 µg/m³, the 36.4 µg/m³ mean represents a significant exceedance of 142.7%. The WHO’s 24-hour guideline for PM10 is 45 µg/m³ (99th percentile), which the reported mean is 19.1% below, if considered a 24-hour average. This highlights that while UK legal requirements may be met for PM10, public health risks, as identified by the WHO, remain significant.
Analysis
The elevated PM2.5 levels present a serious environmental health concern. Particulate matter, especially PM2.5, can penetrate deep into the lungs and enter the bloodstream, leading to both short-term and long-term adverse health outcomes. These include exacerbation of existing respiratory and cardiovascular conditions, and a heightened risk of chronic diseases such as heart disease, cancer, and dementia, with children and the elderly being particularly vulnerable. The WHO's position that there is no safe level of PM2.5 exposure underscores the imperative for significant reductions.
While the PM10 mean falls within current UK legal limits, its exceedance of the stricter WHO annual guideline still indicates a considerable health risk. This highlights a divergence between legally permissible levels in the UK and internationally recognised best practice for public health protection. Approximately half of the UK’s PM concentrations originate from anthropogenic sources, including domestic wood burning and vehicle tyre and brake wear. This necessitates targeted policy interventions by public bodies, under the obligations of the Air Quality Standards Regulations 2010, to reduce emissions at source and ensure compliance. Achieving the more stringent WHO guidelines would offer substantial public health benefits, even beyond current UK legal compliance.
Data Gaps
To sharpen this assessment, the precise averaging period for the 'mean' readings from the sampling session would be crucial for direct comparison against 24-hour specific legal limits and guidelines. Furthermore, details on the specific location of the sampling and the date would allow for a more grounded analysis within local air quality management frameworks and potential identification of local emission sources.
Policy Provisions
| Instrument | Threshold | Status |
|---|---|---|
| Air Quality Standards Regulations 2010 | 20 µg/m³ annual average | exceeded |
| World Health Organisation (WHO) Global Air Quality Guidelines 2021 | 5 µg/m³ annual average | exceeded |
| World Health Organisation (WHO) Global Air Quality Guidelines 2021 | 15 µg/m³ 24-hour average (99th percentile) | exceeded |
| Air Quality Standards Regulations 2010 | 40 µg/m³ annual average | within limits |
| Air Quality Standards Regulations 2010 | 50 µg/m³ 24-hour average (not to be exceeded more than 35 times a year) | within limits |
| World Health Organisation (WHO) Global Air Quality Guidelines 2021 | 15 µg/m³ annual average | exceeded |
| World Health Organisation (WHO) Global Air Quality Guidelines 2021 | 45 µg/m³ 24-hour average (99th percentile) | within limits |
Ammonia (NH₃)
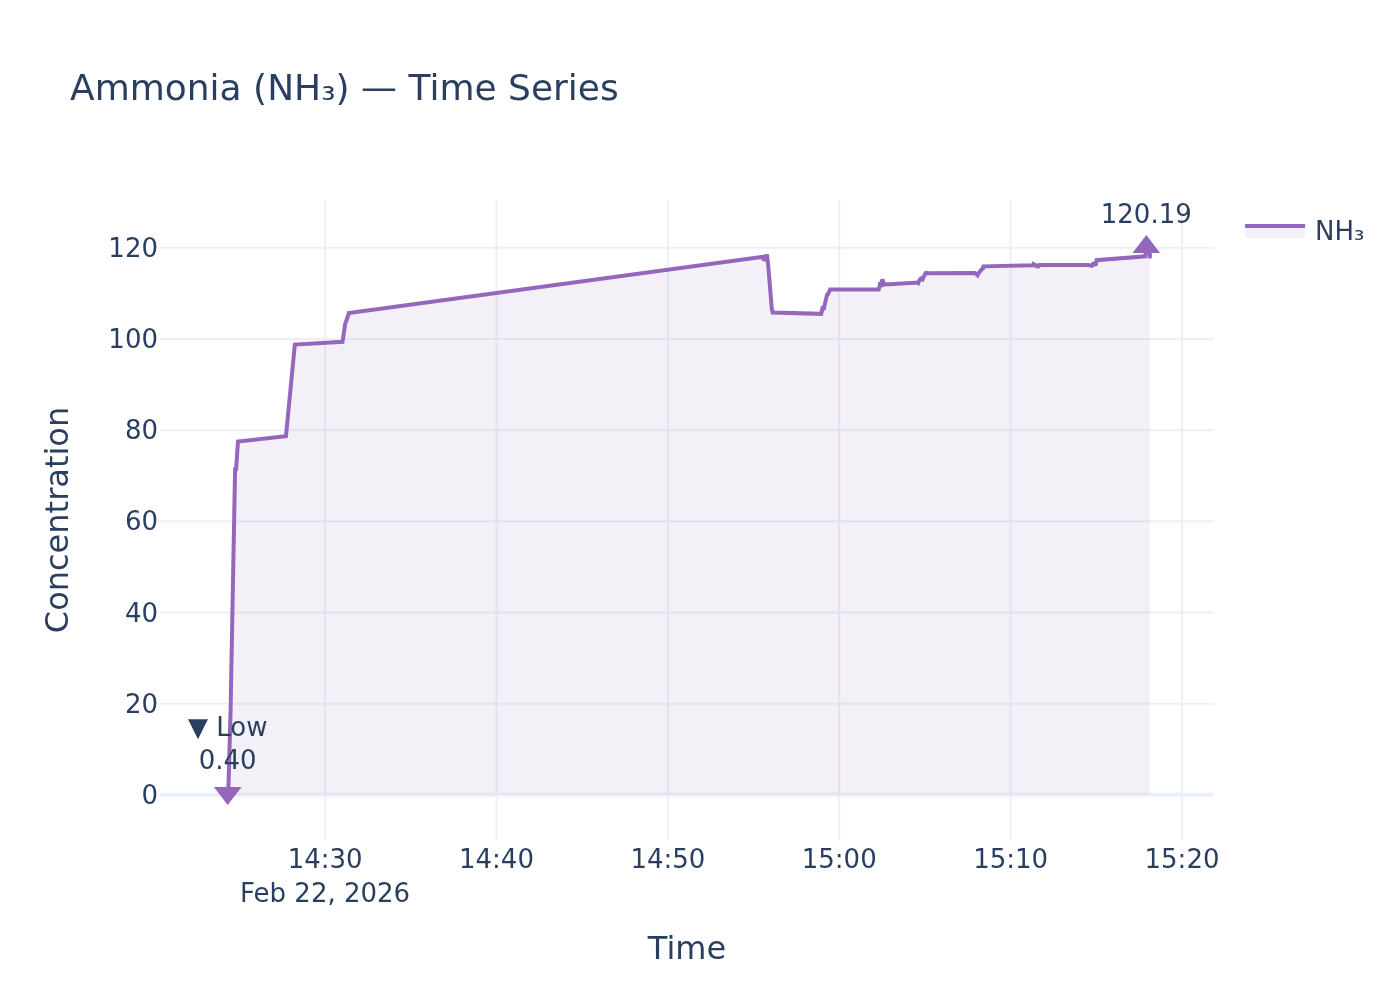
NH₃ concentration time-series.
Static image
Ammonia Readings Highlight Ecological Risk Amidst Absence of UK Ambient Air Quality Limits
An environmental sensor has recorded ammonia (NH₃) readings, showing a high of 120.19, a low of 0.40, and a mean of 102.83. These measurements are assessed against current UK environmental policy.
Findings
An analysis of UK environmental policy reveals that there are no statutory ambient air quality limits for ammonia (NH₃) that local authorities are duty-bound to consider or enforce. While the provided sensor readings of 120.19 (high), 0.40 (low), and 102.83 (mean) indicate the presence and variability of ammonia, they cannot be directly compared against a specific UK legal limit for ambient concentrations. The UK's approach to ammonia primarily focuses on emission reduction targets, with a national statutory goal to reduce emissions by 8% by 2020 and 16% by 2030 from 2005 levels. Additionally, there is a target to reduce the deposition of reactive nitrogen to priority, protected sensitive sites in England by 17% by 2030. The implications of elevated ammonia concentrations are predominantly ecological.
Analysis
While the UK has national statutory targets for reducing ammonia emissions, primarily from agricultural sources which account for approximately 88% of total emissions, there is no corresponding statutory duty on local authorities to monitor or regulate ambient ammonia concentrations. This means that, despite the sensor recording a mean of 102.83 and a high of 120.19, these figures cannot be directly assessed against a legal limit for atmospheric concentration. The primary environmental concern articulated in policy documents for elevated ammonia levels is ecological damage. Ammonia is directly toxic to plants, and at increased concentrations, can lead to common plant species dominating habitats at the expense of rarer ones, altering plant community structure and impacting associated animal species. Furthermore, ammonia reacts with other atmospheric gases to form particulate matter, a secondary pollutant that can travel long distances and affect broader air quality. The policy documents provided do not detail specific direct human health impacts of ammonia at these particular concentration levels, focusing instead on its role in particulate matter formation and its ecological consequences.
Data Gaps
The retrieved policy documents do not specify any UK ambient air quality limits or World Health Organization guidelines for ammonia (NH₃) concentrations. Therefore, a direct comparison of the sensor readings against health-based or environmental protection concentration thresholds is not possible based on the available information. Specific details on direct human health impacts of ammonia at varying concentrations are also absent.
Policy Provisions
| Instrument | Threshold | Status |
|---|---|---|
| LAQM Policy Guidance 2022 | 8% reduction from 2005 levels by 2020, 16% reduction from 2005 levels by 2030 (emission targets) | cannot determine |
| LAQM Policy Guidance 2022 | No statutory LAQM duty for local authorities to consider ammonia (ambient concentrations) | cannot determine |
Noise
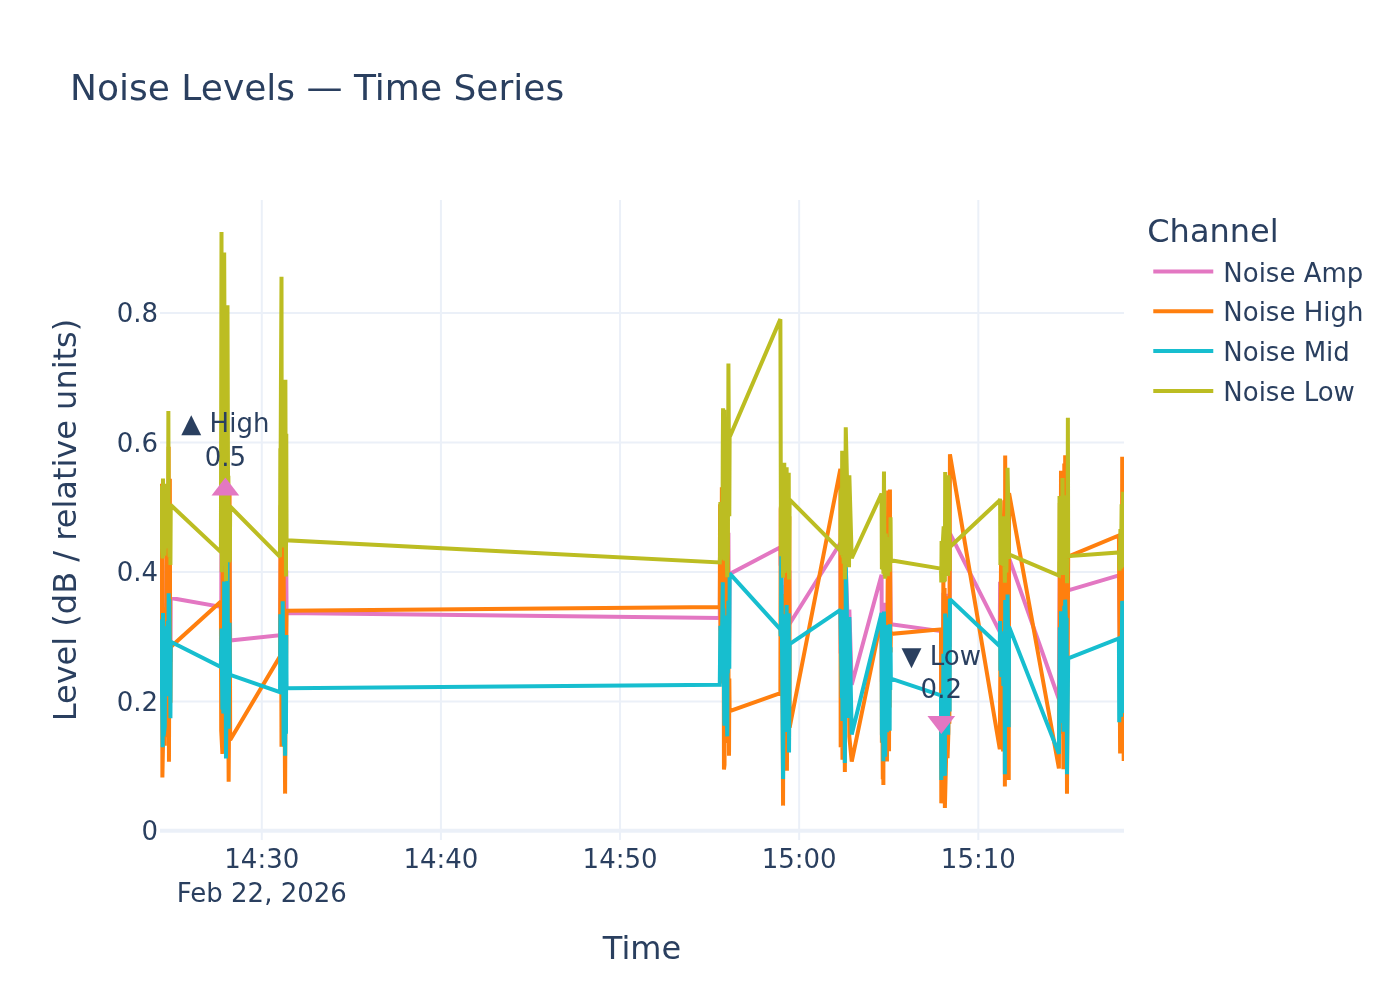
Noise level time-series.
Static image
Environmental Noise Readings Lack Context for Policy Comparison Amidst Absence of Standardised UK and WHO Thresholds for 'Relative Noise Units'
An unspecified environmental noise sensor recorded a high of 0.5, a low of 0.2, and a mean of 0.3, all in 'relative noise units'. The specific location and date of these measurements were not provided.
Findings
A direct comparison of the reported noise levels (0.5 high, 0.2 low, 0.3 mean in relative noise units) against either UK legal limits or WHO environmental noise guidelines is not possible with the currently available information. The WHO Environmental Noise Guidelines for the European Region, developed to protect human health from various noise sources including transportation, wind turbine, and leisure noise, primarily utilise noise indicators such as Lden and Lnight for exposure assessment. The policy documents retrieved do not specify numerical thresholds or limits in 'relative noise units', nor do they provide a conversion or contextual understanding of this measurement unit.
Analysis
The WHO guidelines underscore the critical public health concern of noise pollution and aim to provide recommendations to Member States on protecting human health from environmental noise. The guidelines emphasize the use of standardized noise indicators like Lden and Lnight, which are crucial for consistent exposure assessment and health effect studies. Without a defined unit or a clear correlation to these established indicators, the reported 'relative noise units' cannot be assessed against existing public health recommendations or potential legal obligations. The Seventh Environment Action Programme also highlights a commitment to significantly decrease noise pollution by 2020, moving closer to WHO-recommended levels, underscoring the policy drive to mitigate noise-related health risks. However, the absence of specific numerical thresholds in 'relative noise units' in the policy documents means no determination can be made regarding exceedance or compliance.
Data Gaps
To provide a comprehensive assessment, crucial data is missing. The specific location and date of the noise readings are not provided, which would allow for a more localised policy context. Most significantly, the 'relative noise units' lack definition and a conversion to standard noise indicators such as Lden or Lnight (decibels, dB), which are consistently referenced in WHO guidelines and used for policy-making. Without this, a comparison against UK legal limits or WHO guidelines remains unfeasible. Furthermore, explicit UK-specific environmental noise policy guidance with numerical limits in standard units was not detailed in the retrieved documents.
Sample ID: samples_a6e4179e_73eb_4adb_815e_d9915dfef170