Environmental sensor data for 26 Jan 2025, 00:03–23:56 — 144 readings.
Location Map
Particulate Matter (PM)
Time-series for PM1, PM2.5, and PM10.
Static image
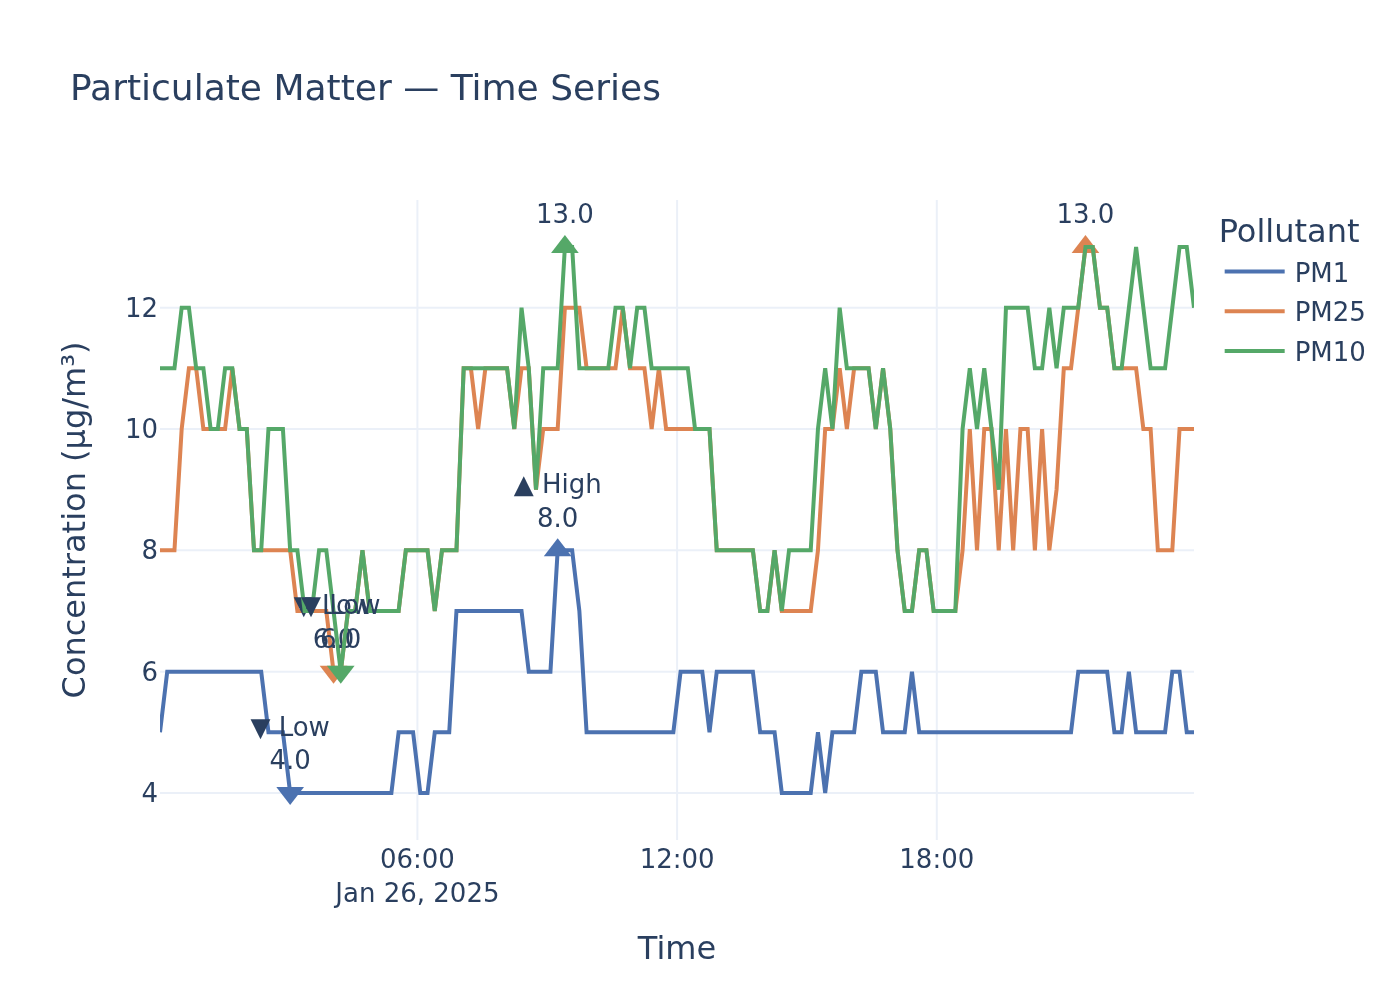
Particulate Matter Readings Well Within UK Legal Limits, Though WHO Guidelines Suggest No Safe Exposure Threshold for PM2.5
During a recent sampling session, environmental sensor readings revealed mean particulate matter concentrations of 5.3 µg/m³ for PM1, 9.2 µg/m³ for PM2.5, and 9.9 µg/m³ for PM10.
Findings
The recorded mean concentrations for PM2.5 and PM10 fall significantly below the current UK air quality legal limits. The mean PM2.5 concentration of 9.2 µg/m³ is 54% below the UK's annual mean legal limit of 20 µg/m³, as mandated by The Air Quality Standards Regulations 2010. Similarly, the mean PM10 concentration of 9.9 µg/m³ is 75.25% below the UK's annual mean legal limit of 40 µg/m³ under the same regulations. For 24-hour PM10 exposure, the recorded high of 13.0 µg/m³ is also well within the UK standard of 50 µg/m³, which must not be exceeded more than 35 times a year.
While these readings are compliant with UK legislation, the World Health Organisation (WHO) issues more stringent guidance, particularly for PM2.5. The WHO considers there to be no safe limit of exposure to PM2.5, and any reduction in its concentration is associated with positive health outcomes. Although specific 2021 WHO guideline values for annual and 24-hour means were not fully detailed in the reviewed policy documents, it is explicitly stated that the WHO’s annual mean PM2.5 recommendation is ‘considerably lower’ than the UK’s legal limit of 20 µg/m³. No specific UK legal limits or WHO guidelines for PM1 were found within the provided policy documents.
Analysis
While the reported particulate matter levels align with current UK legal requirements, the implications for public health, particularly concerning PM2.5, remain significant. PM2.5 is recognised for its ability to penetrate deep into the lungs and enter the bloodstream, leading to both short-term and long-term health consequences including respiratory and cardiovascular diseases, cancer, and dementia. Vulnerable populations, such as the elderly and children, are particularly susceptible to exacerbated pre-existing conditions from elevated concentrations. The WHO's stance that no safe level of PM2.5 exposure exists underscores the ongoing public health imperative to continually reduce these pollutants, even when readings are below legal limits. Anthropogenic sources like domestic wood burning and vehicle emissions are primary contributors to PM in the UK, with environmental effects also including contributions to climate change via black carbon and the formation of secondary PM. Authorities are generally tasked with monitoring and working towards reducing emissions to improve public health outcomes, aligning with the UK's long-term compliance with PM10 and PM2.5 limit values, despite calls for further reductions.
Data Gaps
The current assessment lacks specific UK legal limits or WHO guidelines for PM1 concentrations, precluding any direct policy comparison for this particulate fraction. Furthermore, while the policy documents confirm the WHO's more stringent stance on PM2.5 and PM10, the precise numerical values for the 2021 WHO annual and 24-hour mean guidelines for both PM2.5 and PM10 were not fully visible or detailed in the retrieved excerpts, limiting a precise quantitative comparison against these international recommendations. The provided sensor data represents a 'sampling session' and does not specify an averaging period (e.g., 24-hour, annual), which would allow for a more direct comparison with time-weighted regulatory limits.
Policy Provisions
| Instrument | Threshold | Status |
|---|---|---|
| Air Quality Standards Regulations 2010 | 20 µg/m³ (annual mean) | within limits |
| Air Quality Standards Regulations 2010 | 40 µg/m³ (annual mean) | within limits |
| Air Quality Standards Regulations 2010 | 50 µg/m³ not to be exceeded more than 35 times a year | within limits |
| World Health Organisation Air Quality Guidelines | Considerably lower than 20 μg/m³ (annual mean for PM2.5) | within limits |
| World Health Organisation Air Quality Guidelines | No safe limit of exposure (PM2.5) | cannot determine |
Ammonia (NH₃)
NH₃ concentration time-series.
Static image
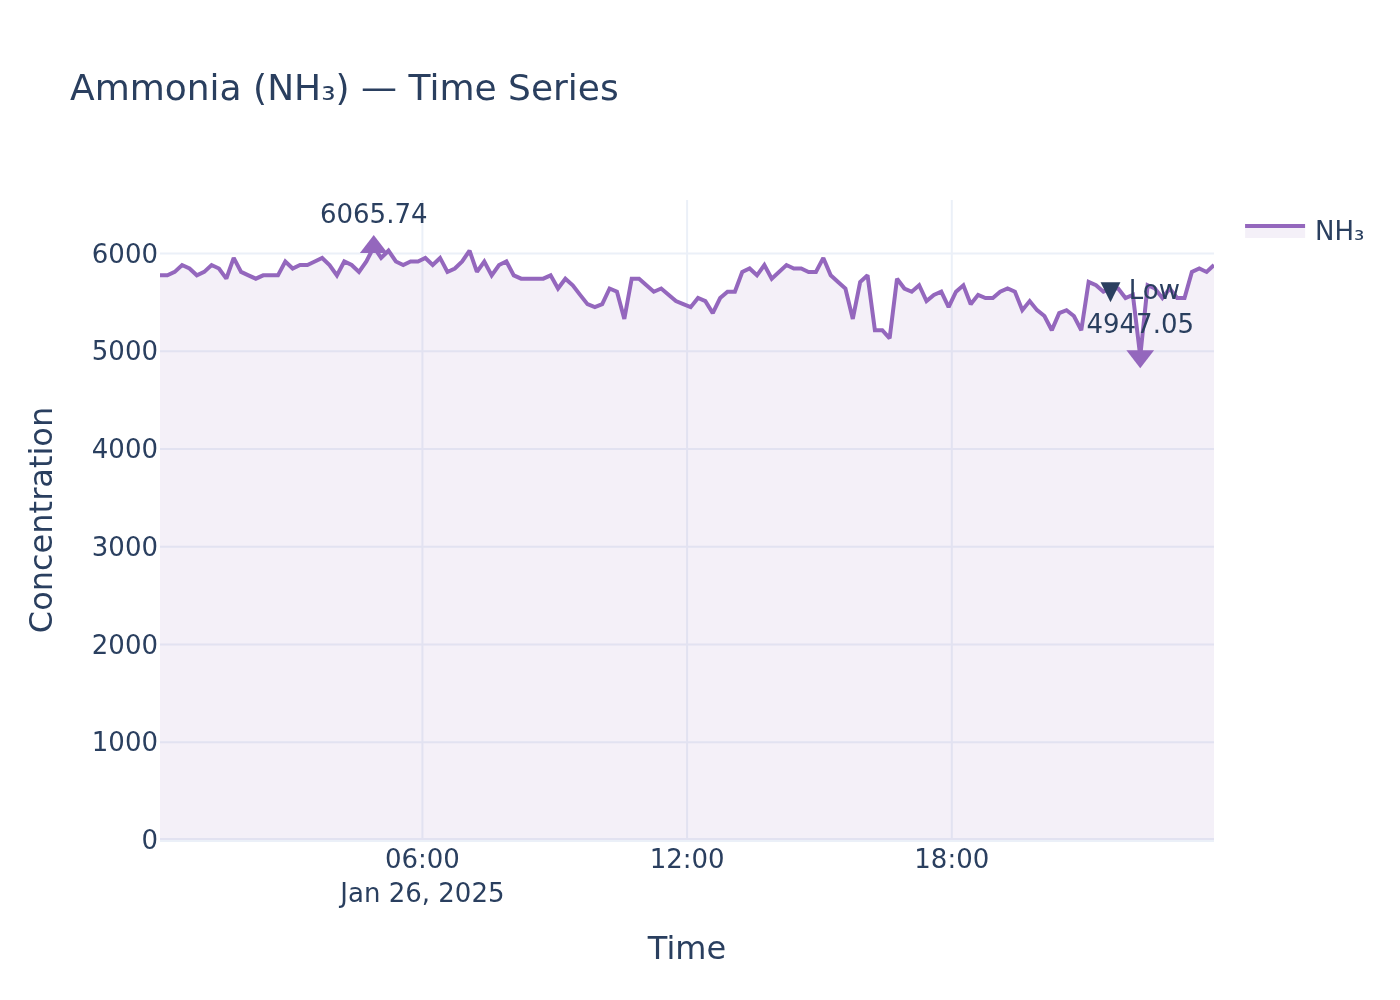
Ammonia Readings Highlight Potential Ecological Risk, But Lack Direct UK Ambient Air Quality Limits
An environmental sensor recorded ammonia (NH₃) levels with a high of 6065.74 µg/m³, a low of 4947.05 µg/m³, and a mean concentration of 5692.23 µg/m³.
Findings
The recorded ammonia concentrations, ranging from 4947.05 µg/m³ to 6065.74 µg/m³ with a mean of 5692.23 µg/m³, cannot be directly compared against statutory UK ambient air quality limits for local authorities. Policy guidance explicitly states there is 'no statutory LAQM duty on local authorities to consider ammonia' (LAQM-Policy-Guidance-2022.pdf, page 63). As such, there are no directly applicable UK legal limits or WHO guidelines for ambient ammonia concentrations provided in the retrieved policy documents to determine if these readings constitute a breach or exceedance. However, the presence of ammonia at these levels carries significant environmental implications, particularly for ecosystems, as detailed below.
Analysis
While direct comparisons to ambient air quality limits for ammonia are not established within current UK policy for local authority monitoring, the environmental implications of elevated ammonia are clear. Ammonia is directly toxic to plants, with some moss and lichen species impacted even at very low concentrations. As ammonia levels increase, it can lead to common plant species dominating habitats, reducing biodiversity and altering plant community structures, which subsequently affects associated animal species (air_pollution_uk_2024_issue_1.pdf, page 41). Furthermore, ammonia is a precursor to secondary particulate matter (PM), reacting with other atmospheric gases like nitrogen oxides and sulphur dioxide to form ammonium sulphate and ammonium nitrate particles. This particulate matter can persist in the air for days and be transported over long distances, impacting air quality far from the emission source (air_pollution_uk_2024_issue_1.pdf, page 41). The vast majority of UK ammonia emissions, approximately 88%, originate from agricultural sources, including organic manures, livestock housing, and manufactured urea-based fertilisers (LAQM-Policy-Guidance-2022.pdf, page 63). The UK has national statutory targets to reduce ammonia emissions by 8% by 2020 and 16% by 2030 from 2005 levels, along with a target to reduce the deposition of reactive nitrogen to priority, protected sensitive sites in England by 17% by 2030 (LAQM-Policy-Guidance-2022.pdf, page 63).
Data Gaps
The retrieved policy documents do not provide specific UK legal limits or WHO guidelines for ambient ammonia (NH₃) concentrations that would allow for a direct comparison with the sensor readings. Therefore, it is impossible to definitively state whether the recorded levels exceed any regulatory thresholds. Further information regarding the specific context of the sensor's location (e.g., proximity to agricultural sources, sensitive ecological sites) would also sharpen the assessment of potential localized impacts.
Noise
Noise level time-series.
Static image
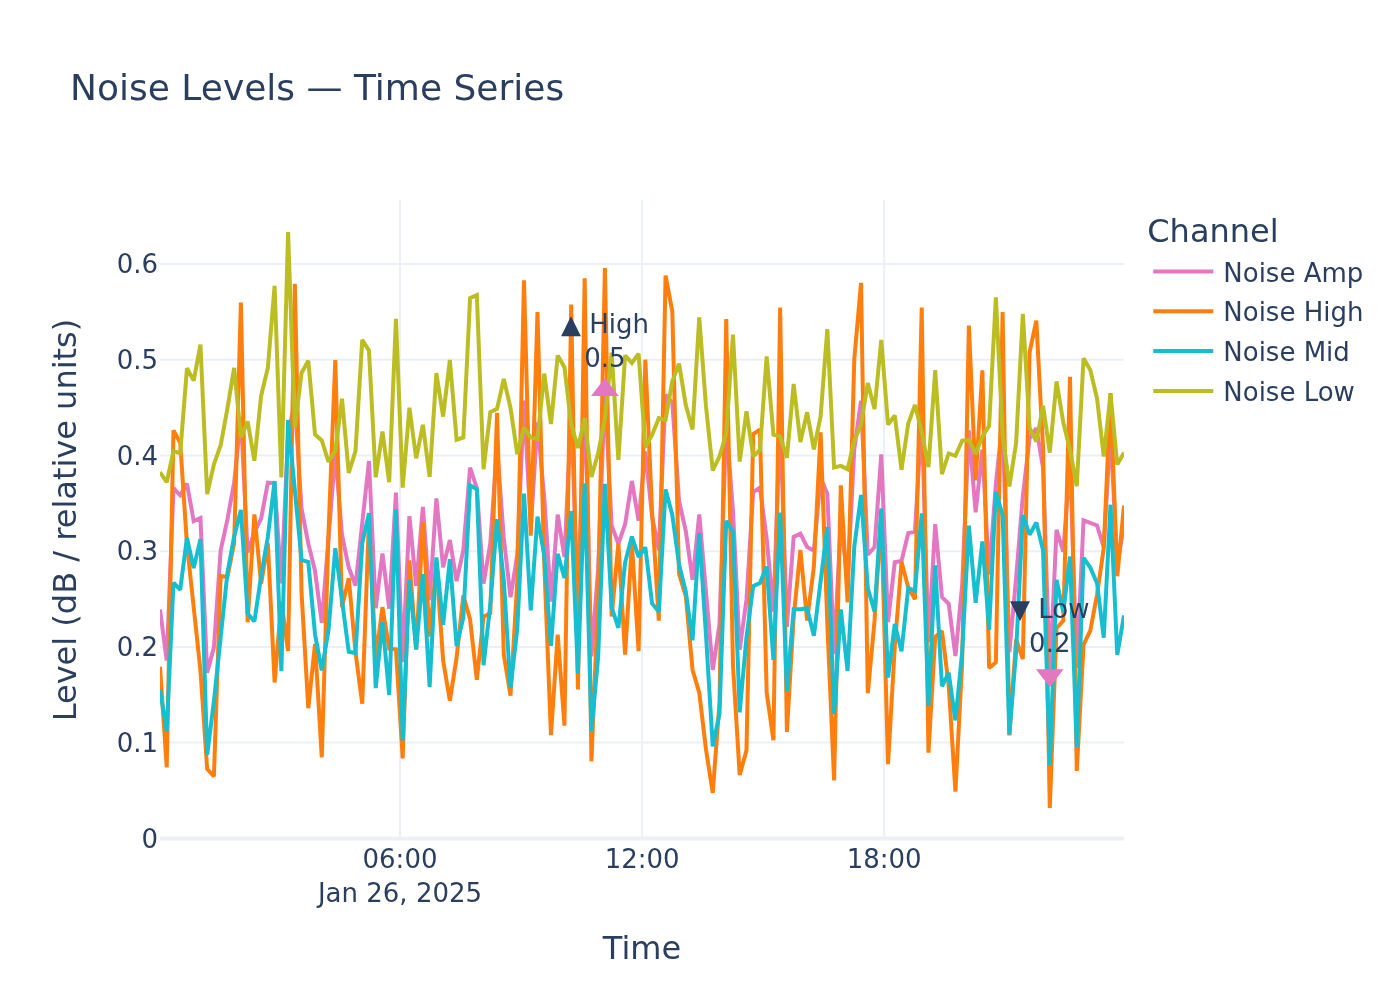
Environmental Noise Readings in 'Relative Units' Cannot Be Compared to UK or WHO Standards Due to Lack of Definitive Policy Guidance
An environmental noise sensor recorded a high of 0.5, a low of 0.2, and a mean of 0.3, all reported in 'relative noise units'.
Findings
Without a clear definition or conversion for 'relative noise units' within established UK environmental policy or WHO environmental noise guidelines, these recorded levels cannot be directly compared to regulatory thresholds. The provided policy documents discuss the importance and scope of environmental noise guidelines, focusing on health impacts and various noise sources like transportation, wind turbines, and leisure activities, but do not provide specific numerical limits in standard decibel (dB) units nor address 'relative noise units'.
Analysis
The absence of specific numerical noise limits in the retrieved UK policy documents and WHO guidelines, particularly in units compatible with the 'relative noise units' provided, prevents a definitive assessment of the reported noise levels. WHO guidelines, such as those for the European Region, aim to protect public health from environmental noise, but without a common unit of measurement or specific thresholds, it is impossible to determine whether the recorded levels pose a health risk or trigger any legal duties for public bodies. To make such an assessment, future monitoring data would need to be provided in standard units like decibels (dB), and specific policy provisions outlining acceptable noise levels in those units would be required.
Data Gaps
The primary data gap is the use of 'relative noise units', which are not defined or referenced in the retrieved UK environmental policy or WHO environmental noise guidelines. Consequently, no direct comparison can be made to established noise limits, which are typically expressed in decibels (dB). Furthermore, the retrieved policy documents, while outlining the general intent and scope of environmental noise management, do not contain specific numerical noise limits in dB that would be necessary for a comprehensive comparison.
Sample ID: samples_be0e9c9d_8fbe_467b_b970_d44984d1e39c