Environmental sensor data for 22 Jun–27 Aug 2024 — 35,174 readings, covering approximately 837.7 km.
Location Map
Particulate Matter (PM)
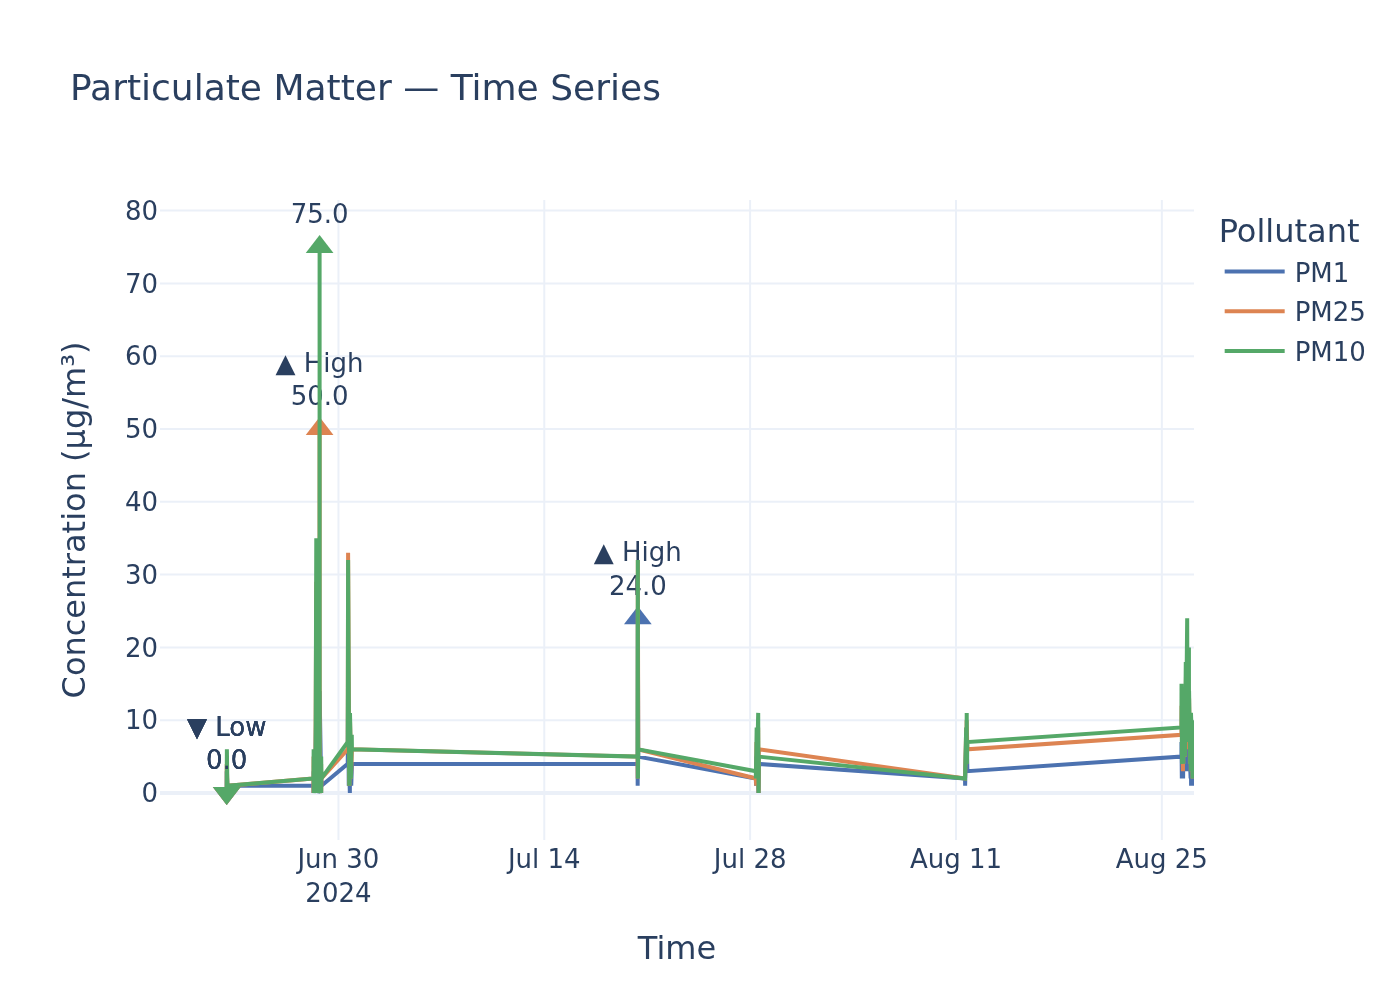
Time-series for PM1, PM2.5, and PM10.
Static image
Particulate Matter Readings Show Significant Exceedances of UK Daily Limit for PM10 and WHO Guidelines for PM2.5 and PM10
During a recent sampling session, an environmental sensor recorded particulate matter concentrations, including PM1, PM2.5, and PM10, providing insights into local air quality.
Findings
Analysis of the environmental sensor data reveals that the highest recorded particulate matter levels surpassed both UK legal limits and stricter World Health Organization (WHO) guidelines for PM10, and WHO guidelines for PM2.5.
For PM10, the sensor’s peak reading of 75.0 µg/m³ significantly exceeded the UK’s 24-hour mean limit of 50 µg/m³, as stipulated in the Air Quality Standards Regulations 2010. This represents an exceedance of 50% above the legal threshold. The WHO’s 2021 guideline for a 24-hour mean PM10 concentration is even stricter at 45 µg/m³, which means the recorded high was 66.7% above this recommended level. While the UK regulation permits this 24-hour limit to be exceeded up to 35 times a year (Regulation X of the Air Quality Standards Regulations 2010), a single reading at this level highlights a significant pollution event. The session’s mean PM10 concentration of 5.9 µg/m³ remained well within both the UK annual mean limit of 40 µg/m³ (85.25% below) and the WHO annual mean guideline of 15 µg/m³ (60.7% below).
For PM2.5, the highest recorded value of 50.0 µg/m³ dramatically exceeded the WHO’s 2021 guideline for a 24-hour mean of 15 µg/m³, indicating a concentration 233.3% higher than recommended. The mean PM2.5 concentration during the sampling session was 5.4 µg/m³. This mean value, while within the UK’s annual mean limit of 20 µg/m³ (73% below), still slightly surpassed the more stringent WHO annual mean guideline of 5 µg/m³ by 8%. The UK currently sets an annual mean limit for PM2.5 at 20 µg/m³ (Air Quality Standards Regulations 2010), with a future target of 10 µg/m³ by the end of 2040 under The Environmental Targets (Fine Particulate Matter) (England) Regulations 2023. No specific UK 24-hour mean limit for PM2.5 was found in the retrieved policy documents for direct comparison with the high reading.
Particulate matter less than 1 micron (PM1) was also recorded, with a high of 24.0 µg/m³ and a mean of 3.6 µg/m³. However, current UK policy documents and WHO guidelines provided do not specify limits or guidelines for PM1 concentrations.
Analysis
The observed particulate matter concentrations during this sampling session highlight potential air quality concerns, particularly regarding short-term exposure to high levels of PM10 and PM2.5. The exceedance of the UK's 24-hour PM10 limit, even if permissible for a limited number of days annually, signifies an episode of elevated pollution that local authorities are obligated to monitor and address under the Air Quality Standards Regulations 2010. Furthermore, the significant breaches of the more stringent WHO guidelines for both PM2.5 and PM10 underscore the health risks associated with these pollution levels. The WHO explicitly states there is no safe limit of exposure to PM2.5, and any reduction in its concentration leads to positive health outcomes. Fine particulate matter (PM2.5) is particularly concerning due to its ability to penetrate deep into the lungs and bloodstream, contributing to respiratory and cardiovascular diseases.
While the mean values for both PM2.5 and PM10 were generally within annual legal limits and, in the case of PM10, even within WHO annual guidelines, the peak readings indicate that acute exposure to harmful levels of air pollution can occur. Public bodies, guided by strategies like the City of London Air Quality Strategy, are tasked with working towards reducing emissions and concentrations of PM2.5, recognising the difficulty in meeting new recommendations and the continuous health benefits of pollution reduction. The legal framework, including The Environmental Targets (Fine Particulate Matter) (England) Regulations 2023, establishes a long-term target for PM2.5 annual mean concentration, emphasising the ongoing commitment to improving air quality.
Data Gaps
To provide a more comprehensive assessment, specific details regarding the location and exact date of the sampling session are crucial. A single sampling session provides a snapshot; a longer time series of data would be necessary to accurately compare against annual mean limits and the number of permitted 24-hour exceedances. Additionally, current UK and WHO policy documents do not specify limits or guidelines for PM1, which represents a gap in regulatory frameworks for this particulate size.
Policy Provisions
| Instrument | Threshold | Status |
|---|---|---|
| Air Quality Standards Regulations 2010 | 50 µg/m³ (24-hour mean, not to be exceeded more than 35 times a year) | exceeded |
| World Health Organisation (2021) WHO global air quality guidelines | 45 µg/m³ (24-hour mean) | exceeded |
| Air Quality Standards Regulations 2010 | 40 µg/m³ (Annual mean) | within limits |
| World Health Organisation (2021) WHO global air quality guidelines | 15 µg/m³ (Annual mean) | within limits |
| Air Quality Standards Regulations 2010 | 20 µg/m³ (Annual mean) | within limits |
| World Health Organisation (2021) WHO global air quality guidelines | 15 µg/m³ (24-hour mean) | exceeded |
| World Health Organisation (2021) WHO global air quality guidelines | 5 µg/m³ (Annual mean) | exceeded |
Ammonia (NH₃)
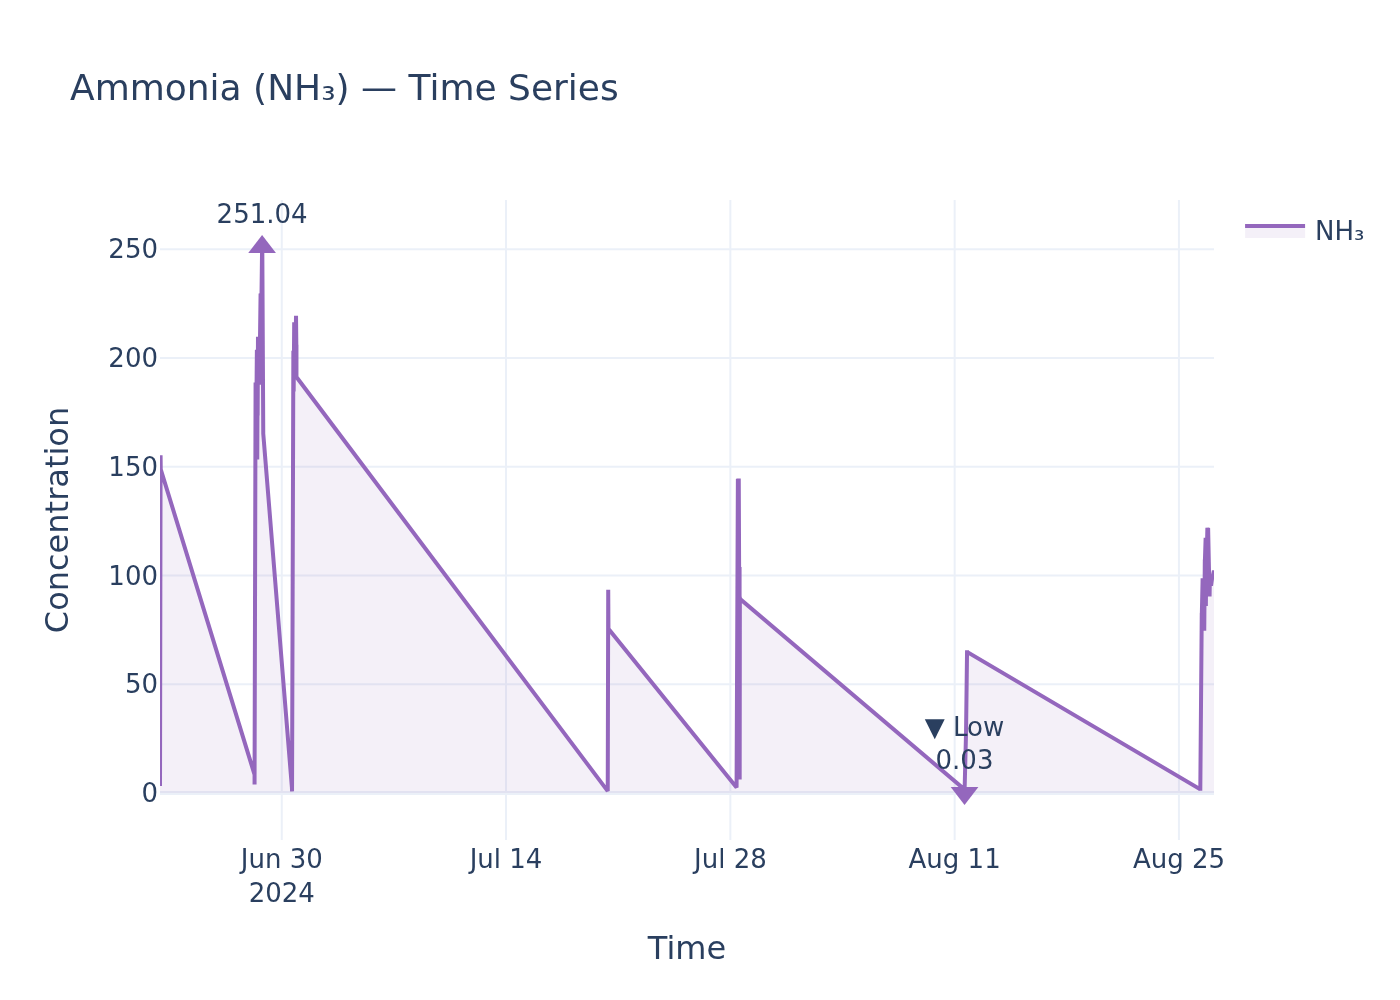
NH₃ concentration time-series.
Static image
Ammonia levels recorded without direct UK ambient air quality limits for comparison, but ecological damage noted at even low concentrations.
An environmental sensor recorded ammonia (NH₃) levels with a high of 251.04, a low of 0.03, and a mean concentration of 130.97. These readings are assessed against available UK environmental policy.
Findings
While the sensor data indicates a significant range in ammonia concentrations, from a low of 0.03 to a high of 251.04, with a mean of 130.97, there are no statutory local air quality management (LAQM) duties for local authorities to consider ammonia ambient concentrations in the same manner as other regulated pollutants. Therefore, a direct comparison against UK legal limits or World Health Organization guidelines for ambient ammonia concentrations cannot be made from the available policy documents. The National Emission Ceilings Regulations (NECR) 2018 set emission reduction commitments for ammonia, with targets to reduce emissions from 2005 levels by 8% by 2020 and 16% by 2030, but these pertain to national emissions, not localised ambient levels.
Analysis
Although there are no direct ambient air quality limits for ammonia concentrations in the UK that local authorities are mandated to consider, the ecological implications of ammonia exposure are well-documented. Ammonia is directly toxic to plants, and elevated levels can lead to significant alterations in plant community structure, potentially displacing rarer species and affecting associated animal populations. Even at very low concentrations, certain moss and lichen species are negatively impacted. The vast majority of ammonia emissions in the UK originate from agricultural practices, predominantly livestock manure, urine, and the application of inorganic fertilisers. While the policy documents refer to national emission reduction targets for ammonia, the lack of specific ambient concentration limits makes it challenging to directly assess the health risks to humans or the immediate environmental compliance for the recorded sensor values within a regulatory framework for local air quality.
Data Gaps
The retrieved policy documents do not provide specific numerical UK legal limits or World Health Organization (WHO) guidelines for ambient ammonia (NH₃) concentrations, which prevents a direct comparison with the sensor readings. Further, while ecological impacts are mentioned, detailed human health implications at specific ammonia concentration levels are not provided within the current policy context. Information on the averaging period for the reported sensor values (high, low, mean) would also sharpen the assessment, as environmental limits often apply over specific timeframes (e.g., hourly, daily, annual means).
Policy Provisions
| Instrument | Threshold | Status |
|---|---|---|
| LAQM Policy Guidance 2022 | Not applicable (no statutory LAQM duty for ammonia ambient concentrations) | cannot determine |
| National Emission Ceilings Regulations (NECR) 2018 | 8% reduction from 2005 levels by 2020; 16% reduction from 2005 levels by 2030 (emission targets) | cannot determine |
Noise
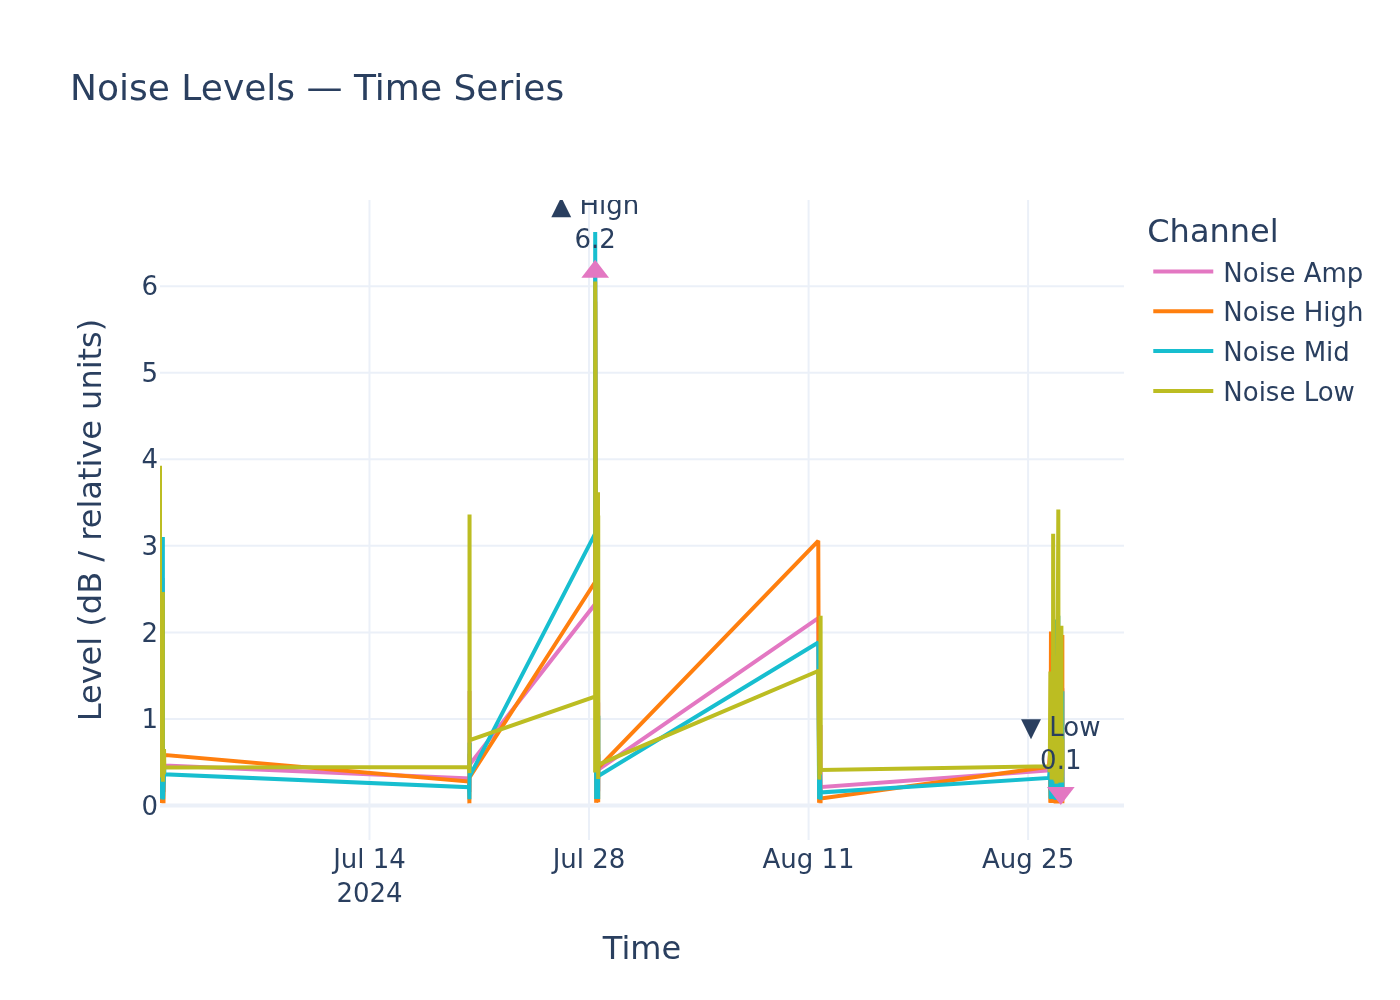
Noise level time-series.
Static image
Absence of Specific Noise Thresholds Prevents Assessment of 'Relative Noise Units' Against UK and WHO Guidelines
An environmental noise sensor recorded levels with a high of 6.2, a low of 0.1, and a mean of 0.3 in 'relative noise units'. These measurements require context from established policy to determine their environmental impact.
Findings
An analysis of UK noise policy and WHO environmental noise guidelines reveals a lack of specific numerical thresholds expressed in 'relative noise units' against which the reported high of 6.2, low of 0.1, and mean of 0.3 can be compared. While policy aims to manage noise for health and quality of life, the absence of directly comparable metrics or a conversion for 'relative noise units' means a definitive assessment of exceedance is not possible.
Analysis
The Noise Policy Statement for England (NPSE) sets out a vision to 'Promote good health and a good quality of life through the effective management of noise'. Its aims are to avoid and mitigate 'significant adverse impacts on health and quality of life' from environmental noise. Although the NPSE provides a policy framework, it is not legislation and does not set specific numerical 'Significant Observed Adverse Effect Level (SOAEL)' values, allowing for flexibility until further evidence emerges. Similarly, the WHO environmental noise guidelines provide policy guidance for the European Region, compatible with the European Union’s Environmental Noise Directive (END), and aim for a significant decrease in noise pollution towards WHO-recommended levels. However, without specific numerical limits in a quantifiable unit such as decibels (dB), or a clear definition of 'relative noise units', it is impossible to determine the health implications or legal duties triggered by the recorded levels. Local authorities are expected to consider the NPSE in relevant situations, and the END requires strategic noise mapping and action plans to manage noise impacts.
Data Gaps
Crucially, the retrieved policy documents do not specify numerical noise limits or guidelines in 'relative noise units', nor do they offer a conversion to standard measurements such as decibels (dB), which are commonly used in environmental noise assessment. Therefore, a direct comparison of the sensor's readings against UK legal limits or WHO guidelines is not possible. To sharpen this assessment, specific numerical thresholds from UK policy or WHO guidelines for noise, expressed in a compatible unit, or a definition of 'relative noise units' would be required.
Sample ID: samples_f61f39b6_97ca_4b39_bb41_af7072a03ee9